STAT 206 Lecture Notes - Lecture 3: Rank, Standard Score, Summary Statistics

Document Summary
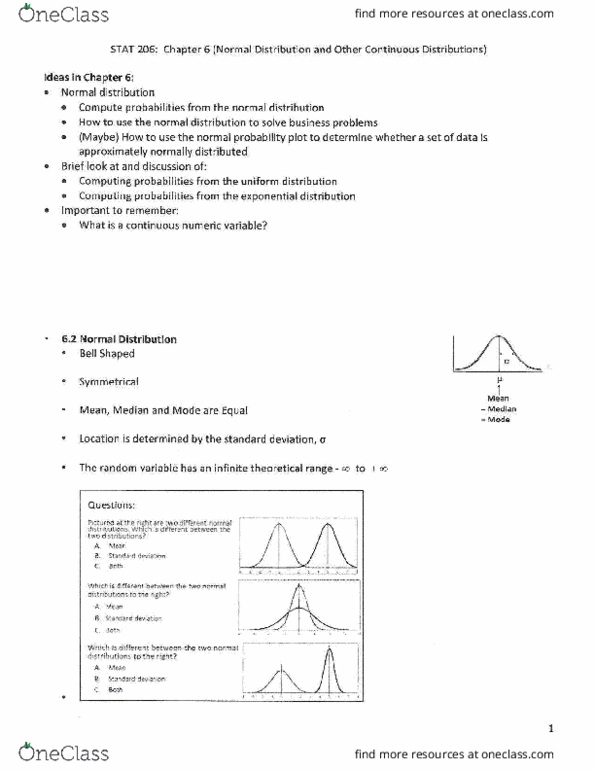
Central tendency is the extent to which values of a variable group around a typical, or central value. Variation measures the amount of dispersion, or scattering from a central value. That is, how spread out are the data values. 3 different ways to consider the center of the distribution . Value divides the upper half from the lower half of the data (median) Let"s call the variable x x or x1= value for one record n= number of values means the sum of all the values. Let"s use our variable x with and ( x-bar ) is the mean of the variable x. Sample mean is the sum of values in a sample divided by the number of values in the sample sum of values/number of values. No individual day had a value of 39. 6. it is an average. No very small or very large values in the data. One extreme value changed the mean by 6 minutes.