 ignore my answers. They are may wrong.
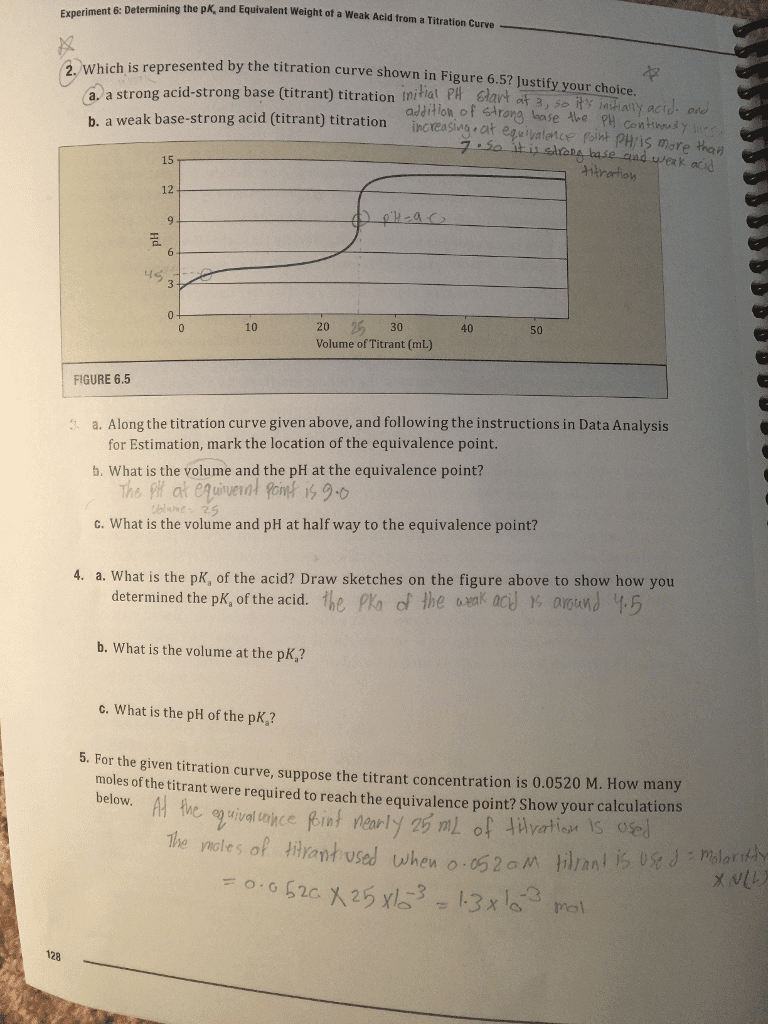
mining the pK, and Equivalent Weight of a Weak Acid from a Titration Curve Experiment 6:D Which is represented by the titration curve shown in Figure 6.5? Justify your choice. 2. a a strong acid-strong base (titrant) titration iniHal PH Ghayt f 3, Se tt b. a weak base-strong acid (titrant) titration addition of rong lhase ve ph cContivudy increasing, atequivalence fo ntPH/is more tha - ea k acid 15 12 10 20 30 40 50 Volume of Titrant (mL) FIGURE 6.5 3 a. Along the titration curve given above, and following the instructions in Data Analysis for Estimation, mark the location of the equivalence point. b. What is the volume and the pH at the equivalence point? The pH al euivennt yond is 9o c. What is the volume and pH at half way to the equivalence point? 4. a. What is the pK, of the acid? Draw sketches on the figure above to show how you determined the pK, of the acid, the PS dlhe teak act} hs around y.5 b. What is the volume at the pK,? c. What is the pH of the pK,? 5. For the given titration curve, suppose the titrant concentration is 0.0520 M. How many moles of the titrant were required to reach the equivalence point? Show your calculations the nales of ant used whew o 062 M 128