PBHL 5401 Lecture Notes - Lecture 21: F-Distribution, Null Hypothesis, Confidence Interval

Document Summary
Get access


Related Documents
Related Questions
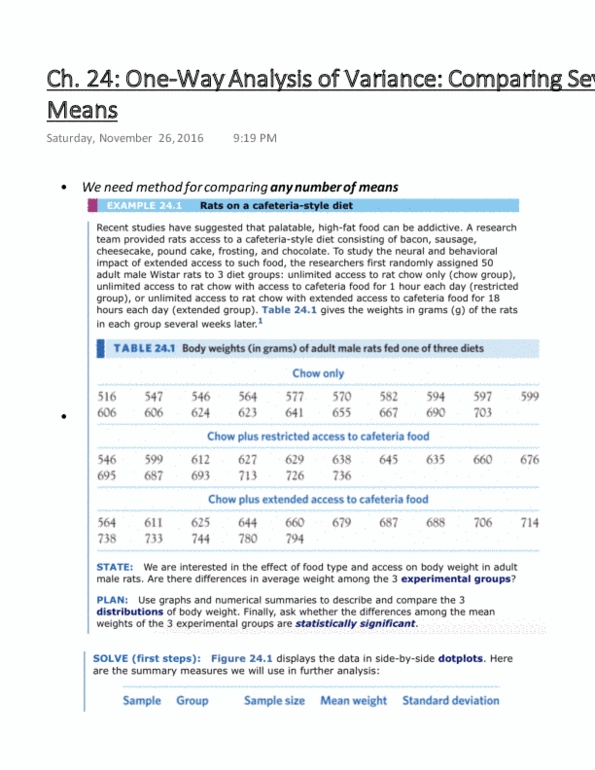
Hypothesis testing with ANOVA opinions about whether caffeine enhances test performance differ. You design a study to test the impact of drinks with different caffeine contents on students' test-taking abilities. You choose 21 students at random from your introductory psychology course to participate in your study. You randomly assign each student to one of three drinks, each with a different caffeine concentration, such that there are seven students assigned to each drink. You then give each of them a plain capsule containing the precise quantity of caffeine that would be consumed in their designated drink and have them take an arithmetic test 15 minutes later.
The students receive the following arithmetic test scores:
| Cola | Black Tea | Coffee | ||
| Caffeine Content (mg/oz) | 2.9 | 5.9 | 13.4 | |
| 85 | 85 | 92 | ∑X2 = 147,641 | |
| 86 | 89 | 87 | G = 1,755 | |
| 82 | 82 | 80 | N = 21 | |
| 75 | 75 | 89 | k = 3 | |
| 66 | 88 | 96 | ||
| 78 | 76 | 83 | ||
| 87 | 82 | 92 | ||
| T1 = 559 | T2 = 559 | T3 = 559 | ||
| SS1 = 338.86 | SS2 = 338.86 | SS3 = 338.86 | ||
| n1 = 7 | n2 = 7 | n3 = 7 | ||
| M1 = 79.8571 | M2 = 79.8571 | M3 = 79.8571 |
1.) You plan to use an ANOVA to test the impact of drinks with different caffeine contents on students' test-taking abilities. What is the null hypothesis?
(a) The population mean test score for the cola population is different from the population mean test score for the black tea population.
(b) The population mean test scores for all three treatments are equal.
(c) The population mean test scores for all three treatments are different.
(d) The population mean test scores for all three treatments are not all equal.
2.) Calculate the degrees of freedom and the variances for the following ANOVA table:
| Source | SS | df | MS |
| Between | - | - | - |
| Within | 702.28 | - | - |
| Total | 973.14 | - |
The formula for the F-ratio is:

3.) Using words, the formula of the F-ratio can be written as:

4.) Using the data from the ANOVA table given, the F-ratio can be written as:

5.) Calculate for F-ratio:

6.) At the 
(a)You can reject the null hypothesis; you do not have enough evidence to say that caffeine affects test performance.
(b)You cannot reject the null hypothesis; caffeine does appear to affect test performance.
(c)You cannot reject the null hypothesis; you do not have enough evidence to say that caffeine affects test performance.
(d)You can reject the null hypothesis; caffeine does appear to affect test performance.


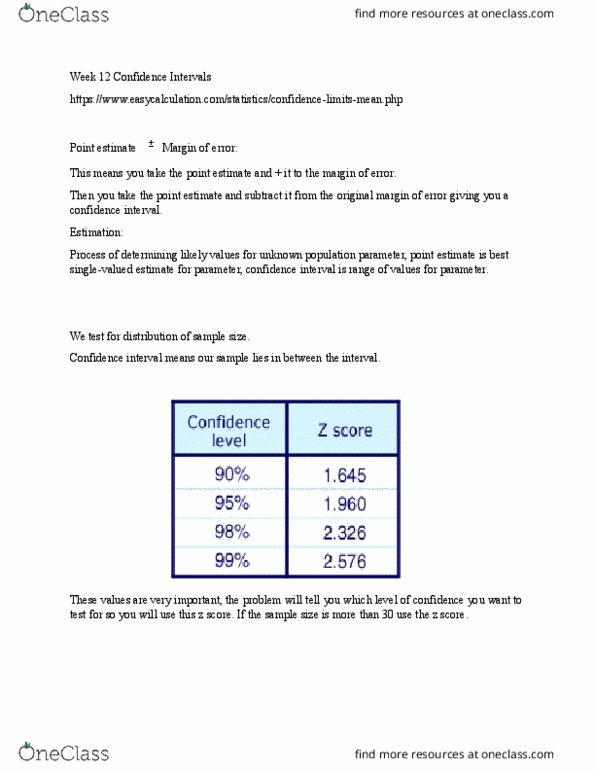
Introduction: A Chi-square test is used to compare observed data with expected data according to a hypothesis. For instance, if you were crossbreeding 2 heterozygous pea plants, you would expect to see a 3:1 phenotypic ratio in the offspring. In this case, if you were to breed 400 pea plants, you would expect to see 300 plants showing the dominant trait and 100 showing the recessive trait. But what happens if you observe only 260 plants with the dominant trait and 140 plants with the recessive trait? Does this mean something is wrong with Mendelian genetics or is this difference in expected results just due to chance (random sampling error)? These are the questions that can be answered using Chi-square statistics. The results of this statistical test is used to either reject or accept (fail to reject) the null hypothesis. The null hypothesis states there is no significant difference between the observed results and the expected results. This means that if the null hypothesis is accepted, the difference in observed and expected results was just a matter of chance and so the observed results basically "fit" with what was expected. Degrees of freedom (df) = number of independent outcomes (Y) being compared less 1 df = Y-1 At the 95% confidence interval we are 95% confident that there is a significant difference between the observed and expected results, therefore rejecting the null hypothesis. Probability Value - Is the decimal value determined from the X2 table and is the probability of accepting the null hypothesis. A 0.05 probability value equates to a 95% confidence interval.
The Chi-squared test formula is: Example: If we cross two pea plants that are heterozygous yellow pods, we would expect a 3:1 phenotypic ratio. So let's say we actually did the cross and got 280 plants with green pods and 120 plants with yellow pods. Question: Is this a 3:1 phenotypic ratio? This is the value of Chi-squared Test. We have a total of 400 plants and we expect a 300 green:100 yellow phenotypic ratio If the calculated Chi-squared value is less than the critical value listed in the Chi-squared table, then we accept the null hypothesis. This means that there is no significant difference between the observed and the expected values. Our degrees of freedom (df) = 2 outcomes - 1, or df = 1. Now we go the X2 table below and using the df = 1 and probability value of 0.05, our critical value is 3.84. Since our calculated X2 value is 5.33, and is larger than the critical value, we reject the null hypothesis and can say (at 95% confidence) that there is a significant difference between our observed and expected values.
The parent generation is yellowed podded and green podded pea plants. You cross a yellow podded pea plant with a green podded pea plant and you get 100% yellow podded plants in the F1 Generation (Phenotypic ratio 4 : 0, yellow to green). What will be the expected phenotypic ratio when you allow the F1 generation to reproduce?
Fill out the Punnett square.
If we actually did the cross and got 1150 yellow and 350 green. Would this be a consistent with what was expected?
Learning Outcomes Questions
1. Why would you run a Chi-squared test?
| To determine if our data is consistent with expected results. | ||
| a To determine if our data is consistent with expected results. b To determine if our data exactly matches the expected results. | ||
| c To determine the expected results. | ||
| d | To compare the phenotypic ratios to the genotypic ratios. |
2. Determine the degrees of Freedom of the phenotypic ratio for this genetic cross.
a. 1
b. 2
c. 3
d. 4
e. 5
3. Using the data given, what is the result of your Chi-squared analysis? x2= ___.
| a. | 2.22 | |
| b | 2.71 | |
| c | 4.36 | |
| d | 187.78 | |
| e | 448.27 |
4. Using the results of your Chi-squared analysis, do we fail to reject or reject the null hypothesis?
| a. | Fail to reject the null | |
| b. | Reject the null | |
| c. | It cannot be determined from the data given |
