🏷️ LIMITED TIME OFFER: GET 20% OFF GRADE+ YEARLY SUBSCRIPTION →
Pricing
Log in
Sign up
Home
Homework Help
Study Guides
Class Notes
Textbook Notes
Textbook Solutions
Booster Classes
Blog
Home
Class Notes
1,200,000
US
530,000
WCOB 1033 Lecture 3: Chapter 2 Visualizing Data, categorical, ranking, part to whole, numerical data, frequency distribution, time series, correlation, histogram, line chart, scatter plot
36
views
1
pages
tealwombat933
28 Jan 2019
School
University of Arkansas
Department
Walton College of Business
Course
WCOB 1033
Professor
aguair
Like
For unlimited access to Class Notes, a
Class+
subscription is required.
Get access
Yearly
Monthly
Yearly
Grade+
20% off
$8
USD/m
$10 USD/m
Billed $96 USD annually
Homework Help
Study Guides
Textbook Solutions
Class Notes
Textbook Notes
Booster Class
40 Verified Answers
Class+
$8
USD/m
Billed $96 USD annually
Homework Help
Study Guides
Textbook Solutions
Class Notes
Textbook Notes
Booster Class
30 Verified Answers
Continue
Related Documents
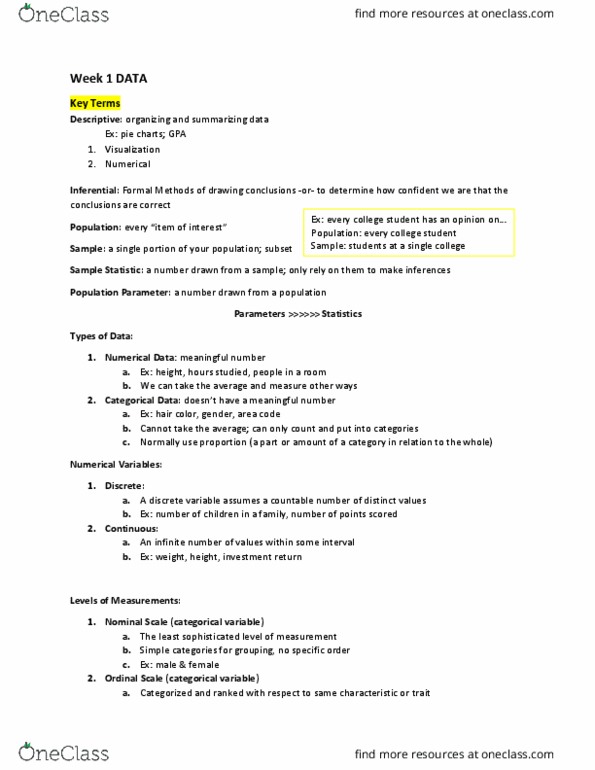
WCOB 1033 Lecture 1: Week 1 DATA, collecting data, probability samples, nonprobability samples, levels of measurements
tealwombat933
WCOB 1033
Final Exam
Study Guide
WCOB 1033 Study Guide - Midterm Guide: Standard Deviation
lilacdolphin866
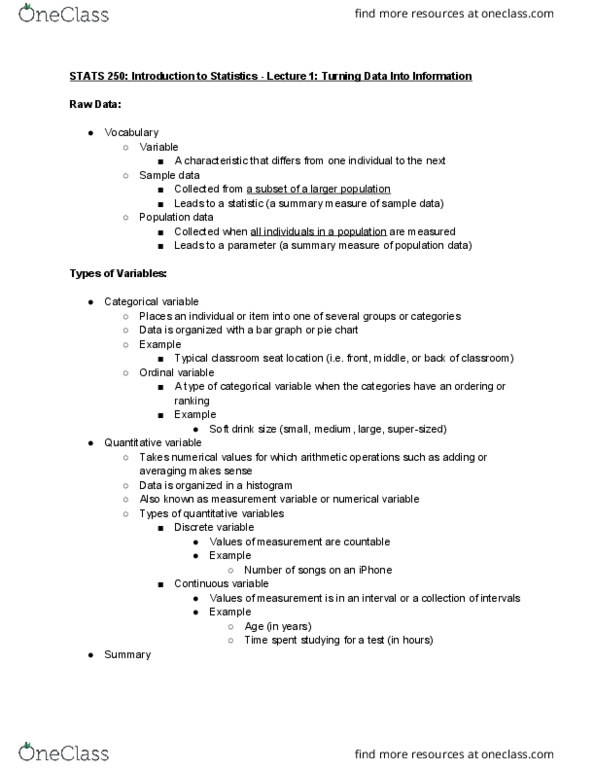
STATS 250 Lecture 1: Turning Data Into Information
amberduck8