ECON 20B Lecture Notes - Lecture 27: Phillips Curve, Congressional Budget Office, Aggregate Demand

ECON 20B verified notes
27/30View all
Document Summary
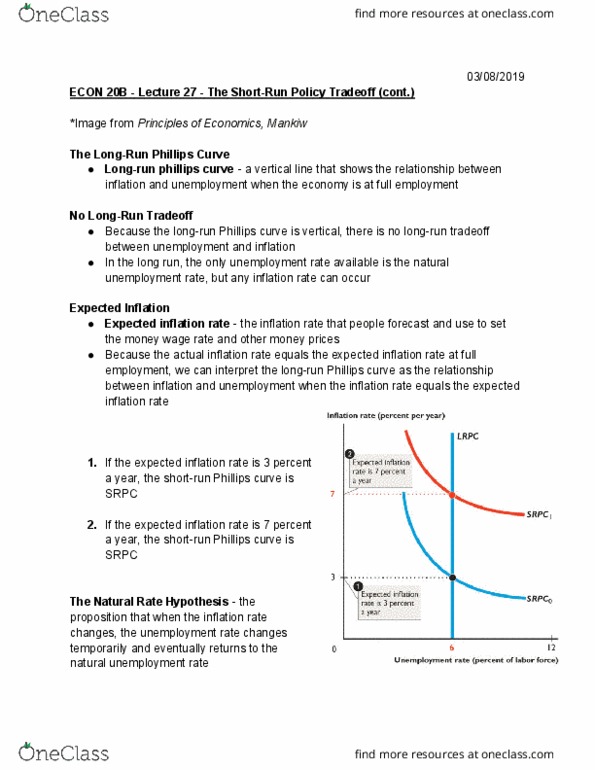
Econ 20b - lecture 27 - the short-run policy tradeoff (cont. ) Long-run phillips curve - a vertical line that shows the relationship between inflation and unemployment when the economy is at full employment. Because the long-run phillips curve is vertical, there is no long-run tradeoff between unemployment and inflation. In the long run, the only unemployment rate available is the natural unemployment rate, but any inflation rate can occur. Expected inflation rate - the inflation rate that people forecast and use to set the money wage rate and other money prices. Srpc: if the expected inflation rate is 7 percent a year, the short-run phillips curve is. The natural rate hypothesis - the proposition that when the inflation rate changes, the unemployment rate changes temporarily and eventually returns to the natural unemployment rate. If the natural unemployment rate changes, both the long-run phillips curve and the short-run phillips curve shift.