STATS 7 Lecture Notes - Lecture 2: Dependent And Independent Variables, Scatter Plot, The Intercept

Document Summary
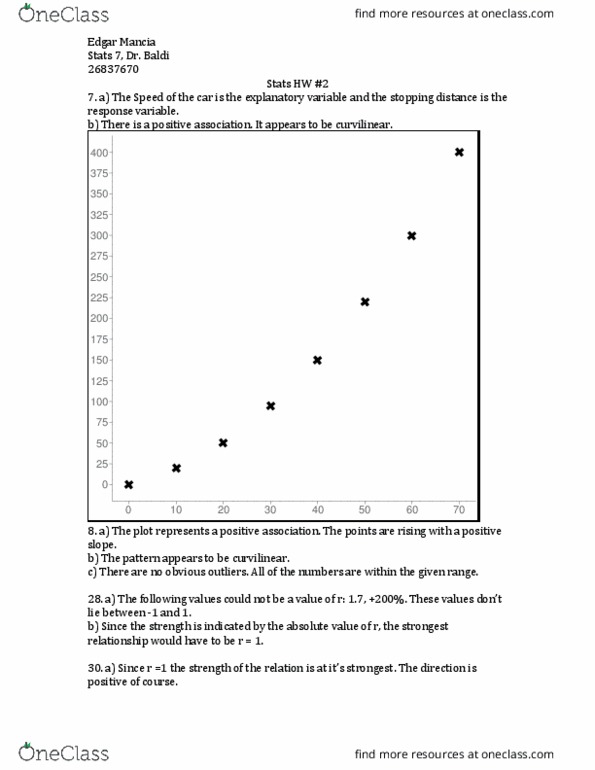
Exercises: 7, 8, 28, 30, 31, 56, 65, 73,78, and 83: a. Variables have a positive correlation relationship: a. The plot shows a positive association between the two variables because the plots are moving upwards on the graph, which signifies a positive slope. The values of one variable tend to increase as the values of the other variable increase: i think the pattern of the plot is linear because the shape of the compilation of the plots is not curvy. And the pattern of their relationship resembles a straight line. When length is increased, chest girth will change strongly in a positive correlation because r= 0. 82, which shows that the relationship has a positive correlation and the value is near +1. Reported correlation values should be supported with either a scatterplot or a description of the scatterplot because scatterplots show the variation and strength of the variables represented on the graph.