STATS 7 Lecture Notes - Lecture 2: Dependent And Independent Variables, Scatter Plot, The Intercept


Edgar Mancia
Stats 7, Dr. Baldi
26837670
Stats HW #2
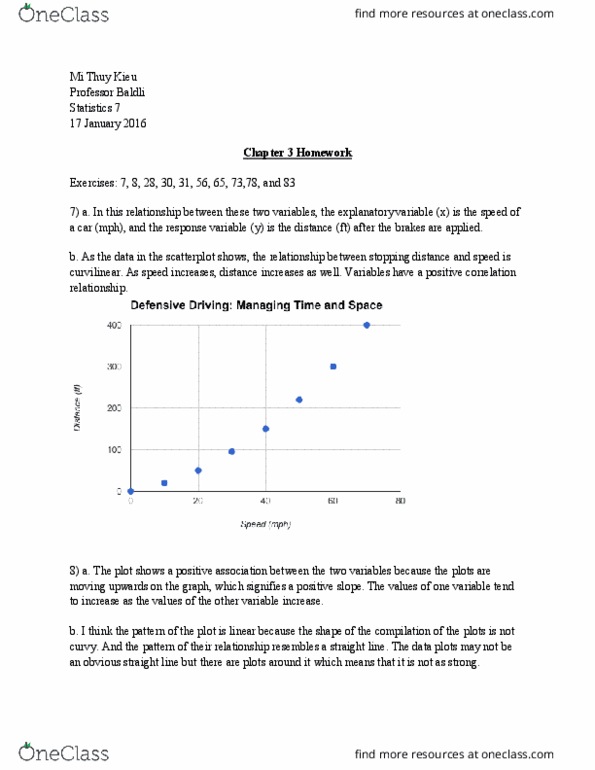
7. a) The Speed of the car is the explanatory variable and the stopping distance is the
response variable.
b) There is a positive association. It appears to be curvilinear.
8. a) The plot represents a positive association. The points are rising with a positive
slope.
b) The pattern appears to be curvilinear.
c) There are no obvious outliers. All of the numbers are within the given range.
28. a) The following values could not be a value of r: .7, +%. These values don’t
lie between -1 and 1.
b) Since the strength is indicated by the absolute value of r, the strongest
relationship would have to be r = 1.
. a) Since r = the strength of the relation is at it’s strongest. The direction is
positive of course.
find more resources at oneclass.com
find more resources at oneclass.com
Document Summary
26837670: a) the speed of the car is the explanatory variable and the stopping distance is the response variable, there is a positive association. Stats hw #2: a) the plot represents a positive association. The points are rising with a positive slope: the pattern appears to be curvilinear, there are no obvious outliers. These values don"t (cid:885)(cid:882). a) since r =(cid:883) the strength of the relation is at it"s strongest. 26837670: (1,1) (2,2) plotting these represents r=1, a) chest girth increases as length increases. B) the value of r is high is there is a strong relationship. C) r=. 82; changing units does not change correlation: a scatterplot is a statistical graphic that displays the strength, shape, and direction between two variables. No matter how strong, correlation still doesn"t imply causation: gender differences create the observed negative correlation. Females tend to be shorter as well as have more earpieces: no because correlation does not prove causation.