ECON 1202 Lecture Notes - Lecture 23: Aggregate Demand, Aggregate Supply, Demand Curve
28 views7 pages
Verified Note

ECON 1202 verified notes
23/29View all

Document Summary
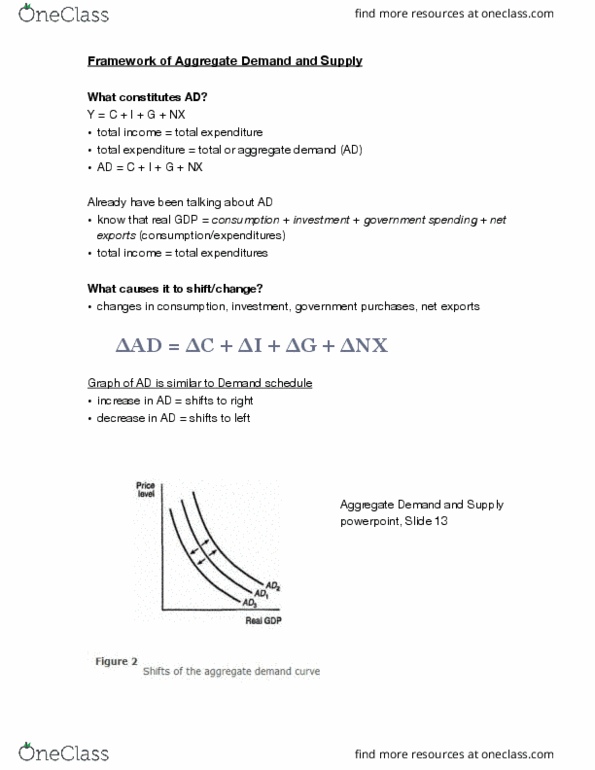
Y = c + i + g + nx: total income = total expenditure, total expenditure = total or aggregate demand (ad, ad = c + i + g + nx. Already have been talking about ad: know that real gdp = consumption + investment + government spending + net exports (consumption/expenditures, total income = total expenditures. What causes it to shift/change: changes in consumption, investment, government purchases, net exports. Graph of ad is similar to demand schedule: increase in ad = shifts to right, decrease in ad = shifts to left. What causes consumption/investment/gov"t expenditures to change: income, people expect higher income = increase expenditures because higher income, wealth, expectation, tax, exchange rate, scal policy, foreign income, monetary policy. Housing boom in 2002: decline in aggregate demand, what is happening: change in consumption. When aggregate collapsed what did feds do: zero interest rates, goal was to shift aggregate demand back, borrow more, spend more.
Get access
Grade+20% off
$8 USD/m$10 USD/m
Billed $96 USD annually

Homework Help
Study Guides
Textbook Solutions
Class Notes
Textbook Notes
Booster Class
40 Verified Answers
Class+
$8 USD/m
Billed $96 USD annually

Homework Help
Study Guides
Textbook Solutions
Class Notes
Textbook Notes
Booster Class
30 Verified Answers
Related Documents

Related Questions
| a) | In the AD-AS model, stagflation does not persist, because the working of the self-correcting mechanism of the economy _____ the level of output and _____ the price level until the economy eventually returns to a long-run equilibrium state, where actual output _____ potential output.
|
| b) | The LRAS curve is drawn as a vertical line at potential output (Y*) to indicate that
|
| c) | Stagflation arises in the context of the AD-AS model when some external factor causes
|
| d) | If the SRAS curve is positively sloped, then a decrease in the demand for Canadian-made goods in Europe will lead to _____ in the price level, in the short run.
|
| e) | Which of the following will shift the aggregate demand curve to the right?
|
| f) | Suppose a stock market crash decreases the stock of household wealth and therefore causes autonomous consumption to fall. Which of the following is the likely result?
|
| g) | An economy is characterized by the AD equation P = 200 ? 0.02Y, SRAS equation P = 100 and LRAS equation Y* = 5000. In the absence of any change in policy or exogenous shocks, this economy will achieve a long-run price level of
|
| h) | The AD-AS model depicts a self-correcting economy. This means that the price level in the model adjusts automatically in response to a(n) _____ gap, so as to eliminate the _____ gap in the long run, without requiring any help from government policies.
|
| i) | The aggregate demand curve shows
|
| j) | Consider an economy initially at long-run equilibrium with output (Y) equal to potential output (Y*). If the SRAS is positively sloped, then a shift to the right of the AD curve will lead to _____ in the price level, in the short run. In the long run, the SRAS curve will shift to the _____ and the equilibrium will be at __________.
|
