AMS 5 Lecture Notes - Lecture 10: South Dakota Highway 45

AMS 5 verified notes
10/20View all
Document Summary
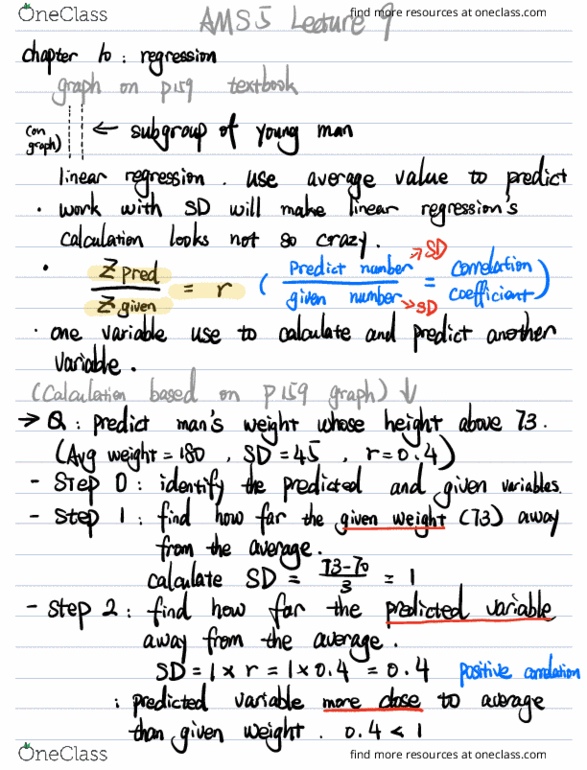
Ams5 lecture 9 chapter lo regression graph on pig textbook agrnaph i i subgroup of young man average value to predict use linear regression work with sd will make linear calculation looks not so crazy. Sd sp correlation coefficient one variable use to calculate and predict another variable calculation based on p159 graph w. Q predict man"s weight whose height above 73. Avg weight 180 step 0 identify the predicted andgiven variables step 1 i find howfar the giveneweight 43 away. Sd 45: 4 r step 2 from the average. 7331 calculate sd find how far the predictedvariable away from the average. Ix r p i predicted variable muse thangiven weight: 4 a 1 to average step 3 i find how many pounds o 4 sd is. 0. 4 45 18 pounds means step 4 i. 18 pounds above average find the prediction in pounds i.