INDE 2333 Lecture Notes - Lecture 2: Pie Chart, Pareto Chart, Bar Chart

16 Jun 2017
School
Department
Course
Professor
Document Summary
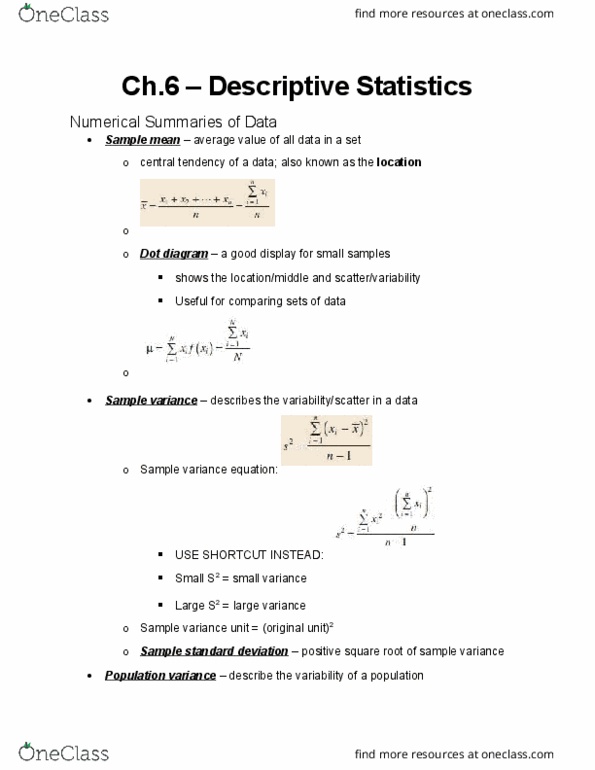
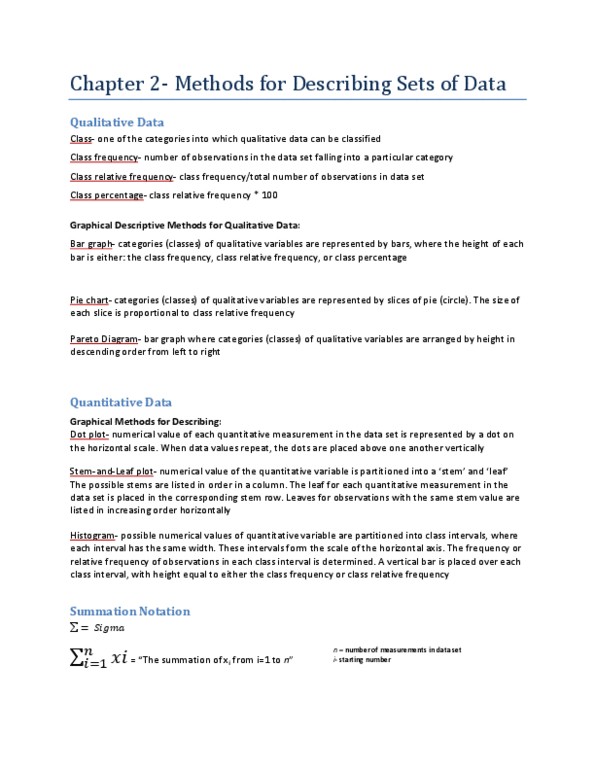
Arithmetic mean average of the measurements. Sample mean central tendency in the data and provides a reasonable estimate of the population mean. o. Population mean mean of finite population. Median middle number when the measurements are arranged in ascending/descending order. Mode value that occurs with greatest frequency. Range difference between the largest and smallest measurements in the data set. Variance sum of squared differences from mean divided by the sample size. Since we do not know the true value of mean: there are n-1 degrees of freedom to provide an unbiased estimate. Standard deviation describes the variability or spread in the data. The sample variance is a reasonable estimate of the population variance. Stem-and-leaf diagram good way to obtain an informative visual display of a data set: how to create a stem-and-leaf diagram. Divide each number into two parts: stem and leaf. List the stem values in a vertical column. Record the leaf for each observation beside its stem.