STAT 2060 Chapter Notes - Chapter 2: Descriptive Statistics, Pie Chart, Squared Deviations From The Mean

3 Feb 2013
School
Department
Course
Professor
Document Summary
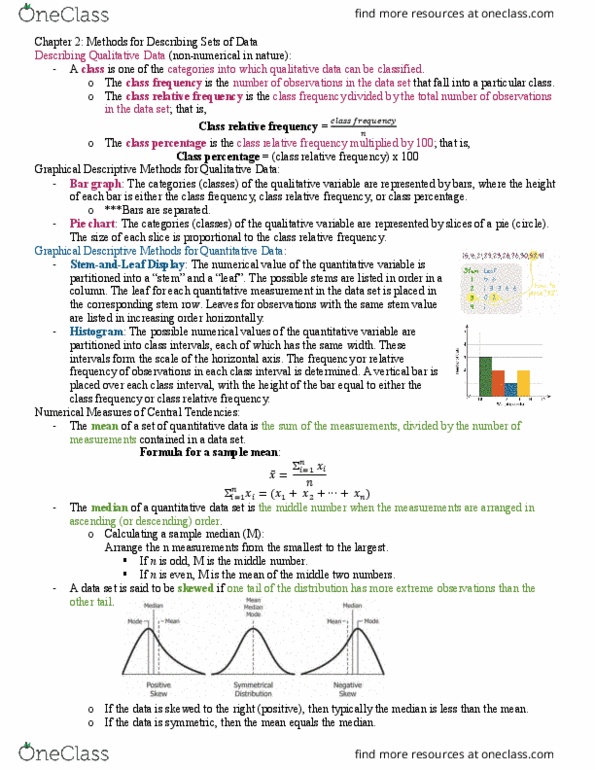
Chapter 2- methods for describing sets of data. Class- one of the categories into which qualitative data can be classified. Class frequency- number of observations in the data set falling into a particular category. Class relative frequency- class frequency/total number of observations in data set. Bar graph- categories (classes) of qualitative variables are represented by bars, where the height of each bar is either: the class frequency, class relative frequency, or class percentage. Pie chart- categories (classes) of qualitative variables are represented by slices of pie (circle). The size of each slice is proportional to class relative frequency. Pareto diagram- bar graph where categories (classes) of qualitative variables are arranged by height in descending order from left to right. Dot plot- numerical value of each quantitative measurement in the data set is represented by a dot on the horizontal scale. When data values repeat, the dots are placed above one another vertically.