STATS 250 Lecture Notes - Lecture 5: Descriptive Statistics, Confidence Interval, Hawthorne Effect
STATS 250 verified notes
5/7View all
Document Summary
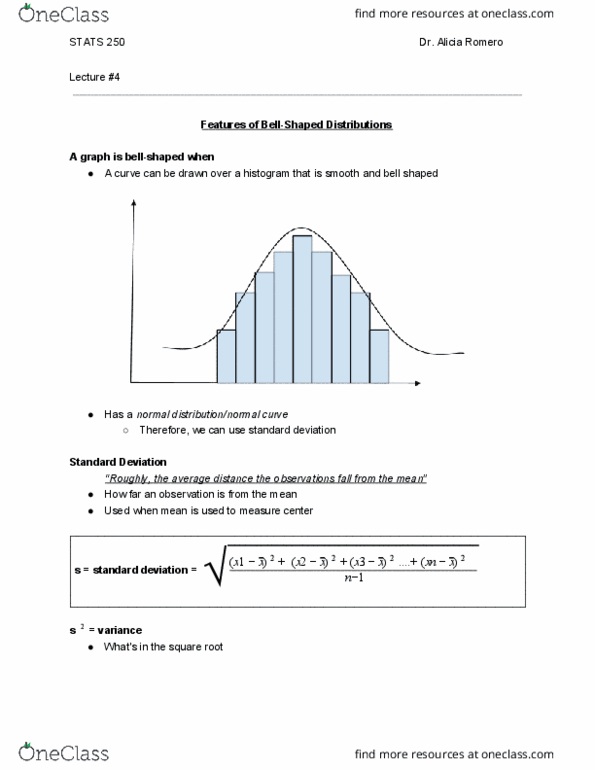
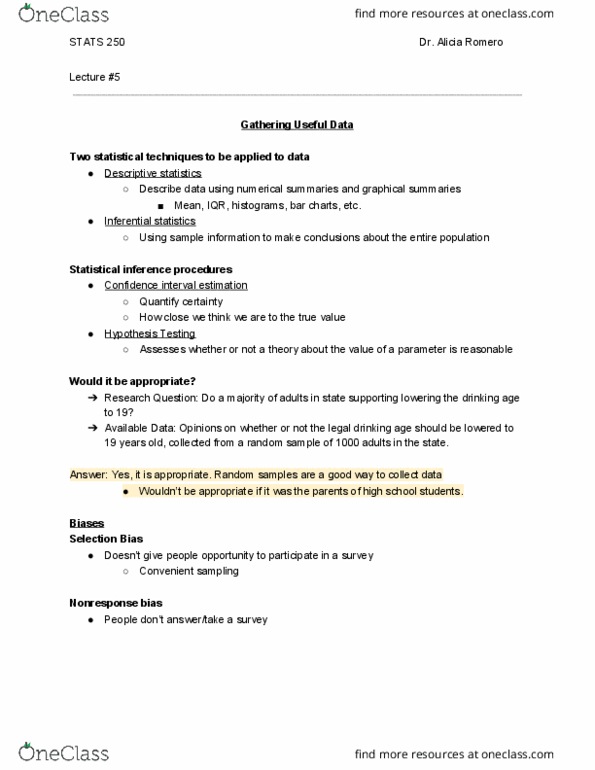
Two statistical techniques to be applied to data. Describe data using numerical summaries and graphical summaries. Using sample information to make conclusions about the entire population. How close we think we are to the true value. Assesses whether or not a theory about the value of a parameter is reasonable. Available data: opinions on whether or not the legal drinking age should be lowered to. 19 years old, collected from a random sample of 1000 adults in the state. Random samples are a good way to collect data. Wouldn"t be appropriate if it was the parents of high school students. Doesn"t give people opportunity to participate in a survey. Topic is sensitive so participants may not be answering truthfully. Behavior improves during observation period, but then returns to usual behavior levels thereafter. Fake treatment that can produce real and positive response. Type of bias questions: magazine sends survey asking if subscribers want more magazines per month.


