POLS 390 Lecture Notes - Lecture 3: Anthony Downs, Percentile, Sampling Error

Document Summary
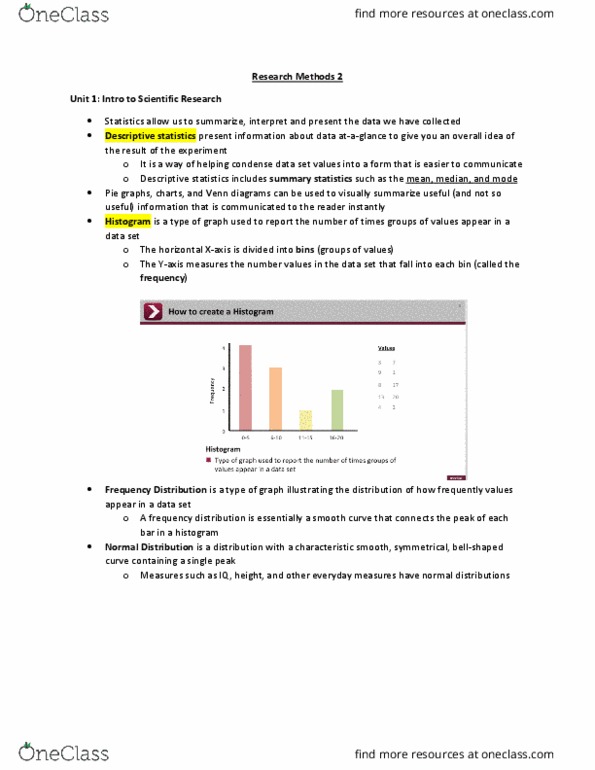
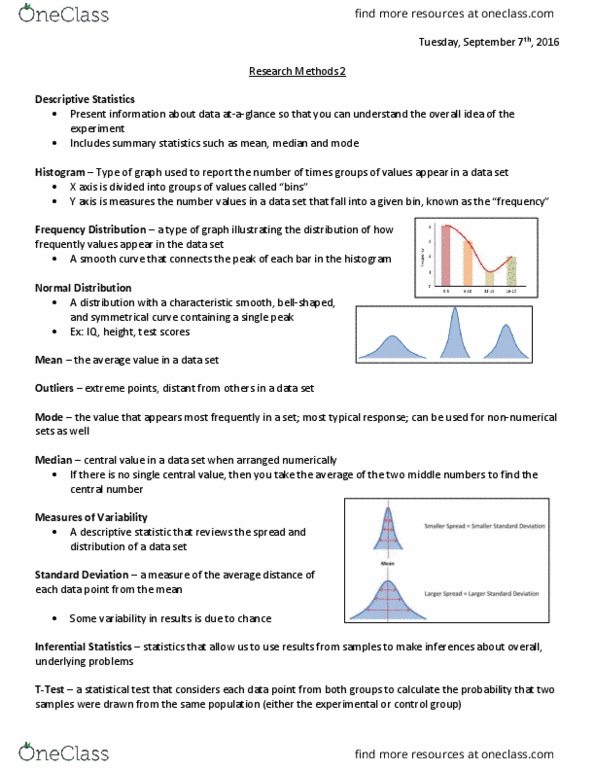
We are interested in how often social phenomena x occur: and what influences the likelihood of x happening. How often does x normally happen in the world we observe without treatment: without knowing this, we can"t posit an effect. The number of occurrences (frequency) on the vertical axis: smooth the dots into bars -> histogram. Many physical and social phenomena distributed similarly, especially with large. Smooth out the histogram= normal curve: a common assumption is that social phenomena is distributed nominally. It"s peak represents mean, median, and mode: mean- mathematical average, median- middle, mode- occurs most. Half of the observations on each side of the center line: 0 is average; half above average, half below. The curve is divided into standard deviations : always three on either side. 2/3 of observations w/in plus or minus 1 sd. 95% of observations w/in plus or minus 2 sd: (hence 95% confidence level in surveys)