STAT 101 Lecture 7: rec07notesadjustedb

Get access


Related textbook solutions

Related Documents
Related Questions


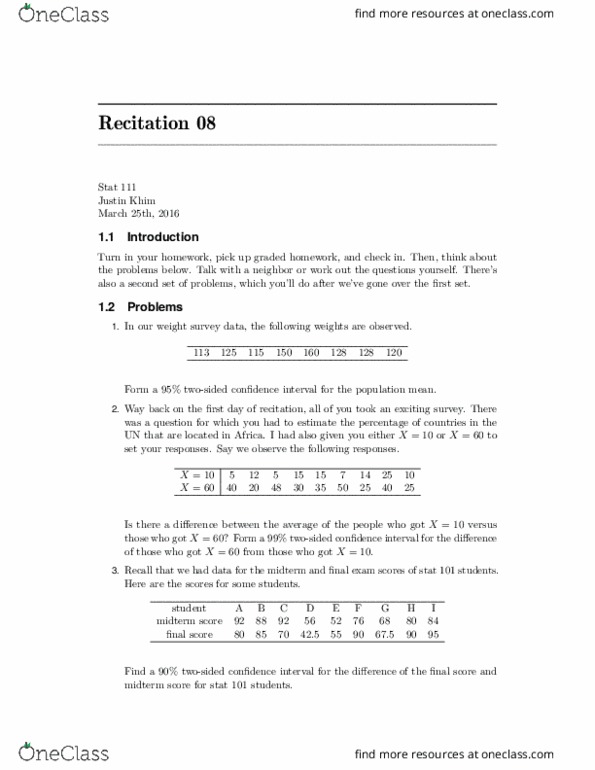
A salesperson makes four calls per year. A sample of 100 days given the following frequencies of sales volumes.
| Number of Sales | Observed Frequency (days) |
| 0 | 30 |
| 1 | 32 |
| 2 | 25 |
| 3 | 10 |
| 4 | 3 |
| TOTAL | 100 |
Records show sales are made to 30% of all sales calls. Assuming independent sales calls, the number of sales per day should follow a binomial distribution. The Binomial distribution is represented by:

For this exercise, assume that the population has a binomial probability distribution with n=4, p=0.30 and x= 0, 1, 2, 3 and 4.
(a) Compute the expected frequencies for x=0, 1, 2, 3 and 4 by using the binomial probability function. Combine categories if necessary to satisfy the requirement that the expected frequency is five or more for all categories.
(b) Use the goodness of fit test to determine whether the assumption of a binomial probability distribution should be rejected. Because no parameters of the Binomial probability distribution were estimated from the sample data, the degrees of freedom are k-1 .

Consider the following Minitab display of two data sets.
| Variable | N | Mean | SE Mean | StDev | Minimum | Q1 | Median | Q3 | Maximum |
| C1 | 20 | 20.00 | 1.62 | 7.26 | 7.00 | 15.00 | 20.00 | 25.00 | 31.00 |
| C2 | 20 | 20.00 | 1.30 | 5.79 | 7.00 | 20.00 | 22.00 | 22.00 | 31.00 |
(1) What are the respective means? The respective ranges?
| C1 |
C2 |
|
| mean | of c1: range of c1: |
mean of c2: range of c2: |
(2) Which data set seems more symmetric? Why?
a. C2 seems more symmetric because the median is greater than the mean.
b. C1 seems more symmetric because the standard deviation is greater than the standard deviation for C2.
c. C1 seems more symmetric because the mean is equal to the median.
d. C2 seems more symmetric because the interquartile range is smaller than the interquartile range for C1.
(3) Compare the interquartile ranges of the two sets. How do the middle halves of the data sets compare?
a. The C1 distribution has a larger interquartile range that is symmetric around the median.
b. The C2 distribution has a smaller interquartile range that is symmetric around the median.
c. The C1 distribution has a smaller interquartile range that is symmetric around the median.
d. The C2 distribution has a larger interquartile range that is symmetric around the median.
