STAT 3006 Lecture Notes - Fall 2018 Lecture 5 - National Transportation Safety Board, Crash test, 2degrees

21 Sep 2018
School
Department
Course
Professor
Daniel T. Eisert STAT-3006
1
12.2 – Analysis of Variance (ANOVA) Testing
Chapter XII: Analysis of Variance
One-Way ANOVA
Model
Random sampling always produces chance variations. Any “factor effect” would
therefore show up in our data as the factor-driven differences plus chance
variations (“error”).
The one-way ANOVA model analyzes data where chance variations are
Normally distributed .
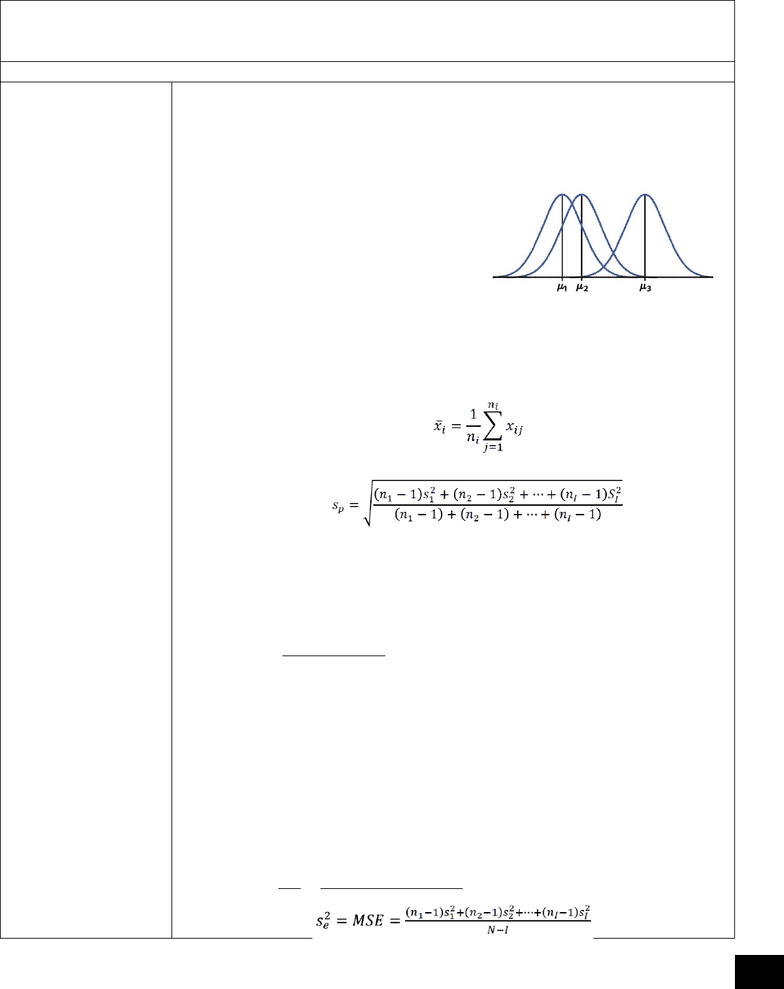
,
for and . The are
assumed to be from a distribution.
The parameters of the model are the
population means and the
common standard deviation .
Estimating the Population Parameters:
- The unknown parameters in the model are the population means and
the common population standard deviation .
- To estimate , we use the sample mean:
- To estimate , we use the pooled standard deviation:
Testing Hypotheses in One-Way ANOVA:
- We want to test the null hypothesis that there are no differences among
the means of the populations.
- Within group variability, under , all populations are identical because we
assume equal variances. So, all
k
samples can be thought of as coming
from one large populations, so therefore, there is only one overall sample
size such that . This allows for a pooled estimate of the
variance by combining all
k
individual sample variances.
- The basic conditions for inference are that we have a random sample from
each population and that each population is Normally distributed.
- The alternative is that there is some difference. That is, not all means are
equal. This hypothesis is not one-sized or two-sided, it is
“many sided.”
- at least two means are difference / not all means are equal.
Group Numeric Measures:
- Mean squared for error: gives an estimate of average variability inside
each group.
-
, so we have:
Document Summary
The parameters of the model are the (cid:1830)(cid:1872)=(cid:1832)(cid:1835)(cid:1846)+(cid:1844)(cid:1857)(cid:1871)(cid:1861)(cid:1856)(cid:1873) Any factor effect would therefore show up in our data as the factor-driven differences plus chance variations ( error ). The one-way anova model analyzes data (cid:3036)(cid:3037) where chance variations are. Normally distributed (cid:1840)(cid:4666)(cid:882),(cid:4667). (cid:3036)(cid:3037)=(cid:3036)+(cid:3036)(cid:3037), for (cid:1835)=(cid:883), ,(cid:1835) and (cid:1862)=(cid:883), ,(cid:3036). The (cid:3036)(cid:3037) are assumed to be from a (cid:1840)(cid:4666)(cid:882),(cid:4667) distribution. population means (cid:2869),(cid:2870), , and the common standard deviation . The unknown parameters in the model are the (cid:1835) population means (cid:3036) and the common population standard deviation . To estimate (cid:3036), we use the sample mean: To estimate , we use the pooled standard deviation: Testing hypotheses in one-way anova: variance by combining all k individual sample variances. each population and that each population is normally distributed. We want to test the null hypothesis that there are no differences among. The basic conditions for inference are that we have a random sample from assume equal variances.