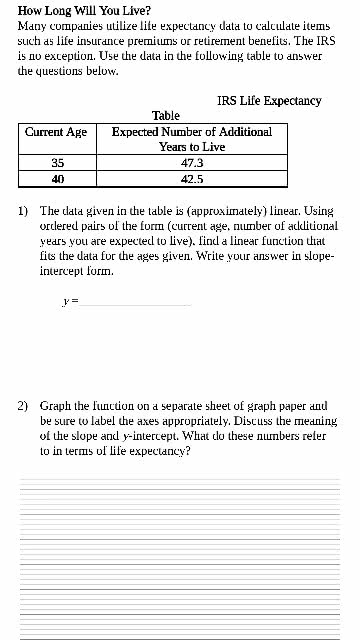
1. IRS Life Expectancy Table:
Current age 35, 47.3 Expected number of additional years to live
Current age 40, 42.5 Expected number of additional years to live
The data given in the table is (approximately) linear. Using ordered pairs of the form (current age, number of additional years you are expected to live), find a linear function that fits the data for the ages given. In slope-intercept form.
y = ?
Graph the function and label.
What is the slope and y-intercept?
What do these numbers refer to in terms of life expectancy?
What does the slope line mean?
Discuss the meaning of the slope and y-intercept.
What do these numbers refer to in terms of life expectancy?
What is the y intercept and what does it mean?
Using the function in question 1, calculate the number of additional years that a 72 year-old person can expect to live.
What is the result of adding together the x- and y-coordinates of any ordered pair in this situation?