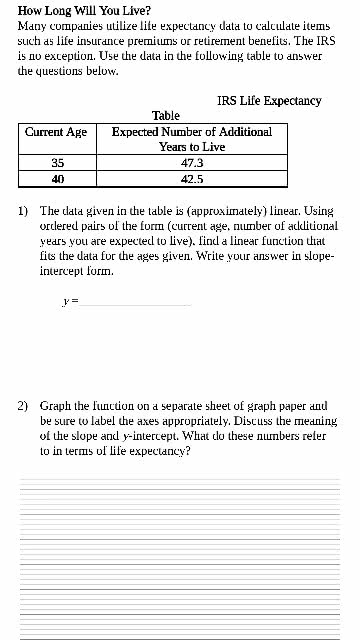
How Long Will You Live? Many companies utilize life expectancy data to calculate items such as life insurance premiums or retirement benefits. The IRS is no exception. Use the data in the following table to answer the questions below. 1) The data given in the table is (approximately) linear. Using ordered pairs of the form (current age, number of additional years you are expected to live), find a linear function that fits the data for the ages given. Write your answer in slope-intercept form. y = 2) Graph the function on a separate sheet of graph paper and be sure to label the axes appropriately. Discuss the meaning the slope and y-intercept. What do these numbers refer to in terms of life expectancy?
Show transcribed image textHow Long Will You Live? Many companies utilize life expectancy data to calculate items such as life insurance premiums or retirement benefits. The IRS is no exception. Use the data in the following table to answer the questions below. 1) The data given in the table is (approximately) linear. Using ordered pairs of the form (current age, number of additional years you are expected to live), find a linear function that fits the data for the ages given. Write your answer in slope-intercept form. y = 2) Graph the function on a separate sheet of graph paper and be sure to label the axes appropriately. Discuss the meaning the slope and y-intercept. What do these numbers refer to in terms of life expectancy?