HELP ON ECOLOGY LAB REPORT PLEASE!!!
- The AIM of this lab exercise: Does Eastern Mosquitofish (Gambusia holbrooki) population structure differ with season?
- You will compare population structure in an FIU pond from February 2018 (previous semester) with the data that you collect this semester (September 2018).
- CREATE HYPOTHESIS ABOUT POPULATION STRUCTURE (HELP PLEASE)
(HELP PLEASE) Include at least one paragraph ON THE key points of comparison between the life tables. Include the major results for population structure, even if no difference is found! Do these populations differ with respect to optimal age of sexual maturity, R0, G, and r?
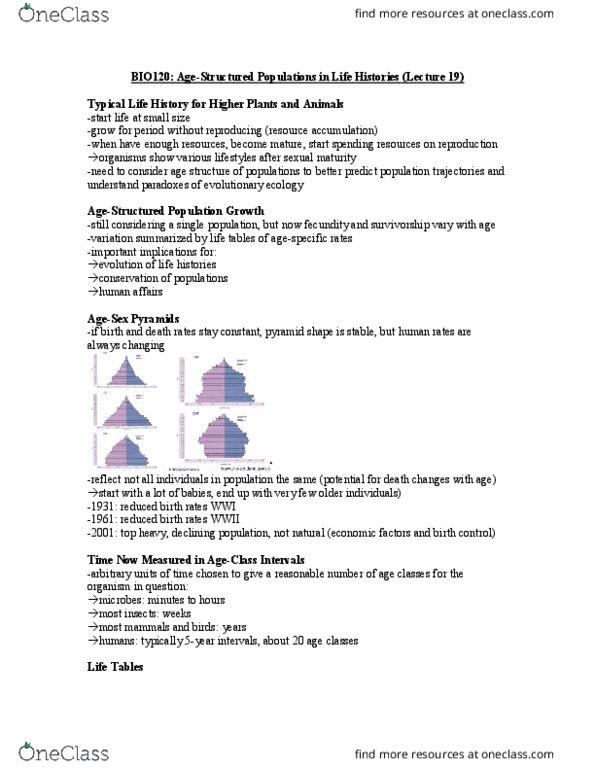
FEBRUARY 2018 CURRENT RESULTS
Age Class (days)
x Sample/ Age
s(x) Number/ Age
n(x) Survival Rate
1(x) Fecundity b(x) Offspring/Ind 1(x)*b(x) Age Weighted Fecundity 1(x)*b(x)*x
0 24 120 1 0 0 0 30 39 96 0.8 0 0 0 60 19 57 0.475 0 0 0 90 21 38 0.317 24 7.608 684.72 120 8 17 0.142 27 3.834 460.08 150 5 9 0.075 29 2.175 326.25 180 2 4 0.033 32 1.056 190.08 210 0 2 0.017 0 0 0 240 1 2 0.017 0 0 0 Sum 120 R0 14.673 Offspring
G 113.209 Days r 0.024 Ind/ Days
Optimal Age for Sexual Maturity
120 Days
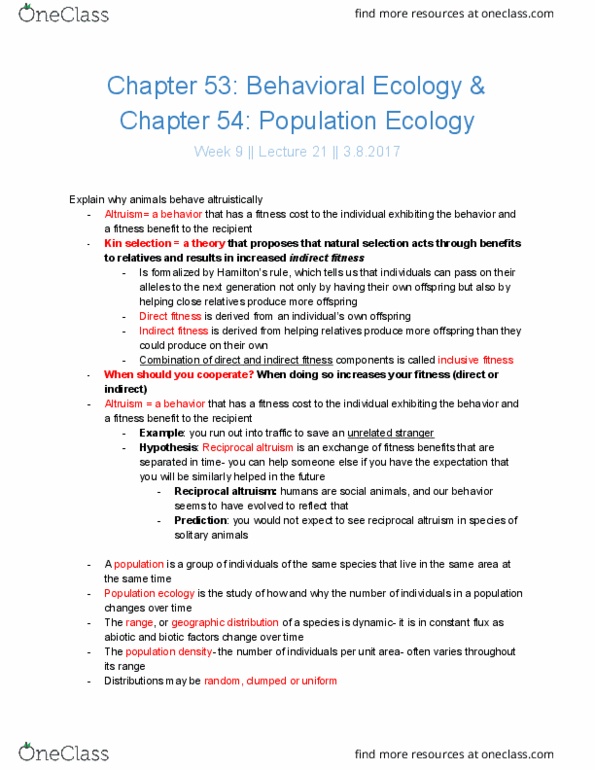
SEPTEMBER 2018 RESULTS:
Life Table Age class (days) Sample/ age class Number/ age class Survival rate Fecundity Offspring/ individual Age-weighted fecundity x n(x) n(x) l(x) b(x) l(x)*b(x) l(x)*b(x)*x 0 9 150 1 0 0 0 30 12 141 0.94 0 0 0 60 26 129 0.86 0 0 0 90 29 103 0.687 24 16.48 1483.2 120 33 74 0.493 27 13.32 1598.4 150 18 41 0.273 29 7.93 1189 180 16 23 0.153 32 4.91 883.2 210 7 7 0.047 0 0 0 240 0 0 0 0 0 0 Sum 150 R0 42.63 offspring G 120.89 days r 0.03 individuals/ day Optimal age for sexual maturity 120 days
HELP ON ECOLOGY LAB REPORT PLEASE!!!
- The AIM of this lab exercise: Does Eastern Mosquitofish (Gambusia holbrooki) population structure differ with season?
- You will compare population structure in an FIU pond from February 2018 (previous semester) with the data that you collect this semester (September 2018).
- CREATE HYPOTHESIS ABOUT POPULATION STRUCTURE (HELP PLEASE)
(HELP PLEASE) Include at least one paragraph ON THE key points of comparison between the life tables. Include the major results for population structure, even if no difference is found! Do these populations differ with respect to optimal age of sexual maturity, R0, G, and r?
FEBRUARY 2018 CURRENT RESULTS
| Age Class (days) x | Sample/ Age s(x) | Number/ Age n(x) | Survival Rate 1(x) | Fecundity b(x) | Offspring/Ind 1(x)*b(x) | Age Weighted Fecundity 1(x)*b(x)*x |
| 0 | 24 | 120 | 1 | 0 | 0 | 0 |
| 30 | 39 | 96 | 0.8 | 0 | 0 | 0 |
| 60 | 19 | 57 | 0.475 | 0 | 0 | 0 |
| 90 | 21 | 38 | 0.317 | 24 | 7.608 | 684.72 |
| 120 | 8 | 17 | 0.142 | 27 | 3.834 | 460.08 |
| 150 | 5 | 9 | 0.075 | 29 | 2.175 | 326.25 |
| 180 | 2 | 4 | 0.033 | 32 | 1.056 | 190.08 |
| 210 | 0 | 2 | 0.017 | 0 | 0 | 0 |
| 240 | 1 | 2 | 0.017 | 0 | 0 | 0 |
| Sum | 120 | R0 | 14.673 Offspring | |||
| G | 113.209 Days | |||||
| r | 0.024 Ind/ Days | |||||
| Optimal Age for Sexual Maturity | 120 Days |
SEPTEMBER 2018 RESULTS:
| Life Table | ||||||
| Age class (days) | Sample/ age class | Number/ age class | Survival rate | Fecundity | Offspring/ individual | Age-weighted fecundity |
| x | n(x) | n(x) | l(x) | b(x) | l(x)*b(x) | l(x)*b(x)*x |
| 0 | 9 | 150 | 1 | 0 | 0 | 0 |
| 30 | 12 | 141 | 0.94 | 0 | 0 | 0 |
| 60 | 26 | 129 | 0.86 | 0 | 0 | 0 |
| 90 | 29 | 103 | 0.687 | 24 | 16.48 | 1483.2 |
| 120 | 33 | 74 | 0.493 | 27 | 13.32 | 1598.4 |
| 150 | 18 | 41 | 0.273 | 29 | 7.93 | 1189 |
| 180 | 16 | 23 | 0.153 | 32 | 4.91 | 883.2 |
| 210 | 7 | 7 | 0.047 | 0 | 0 | 0 |
| 240 | 0 | 0 | 0 | 0 | 0 | 0 |
| Sum | 150 | |||||
| R0 | 42.63 | offspring | ||||
| G | 120.89 | days | ||||
| r | 0.03 | individuals/ day | ||||
| Optimal age for sexual maturity | 120 | days | ||||