1
answer
0
watching
140
views
13 Nov 2019
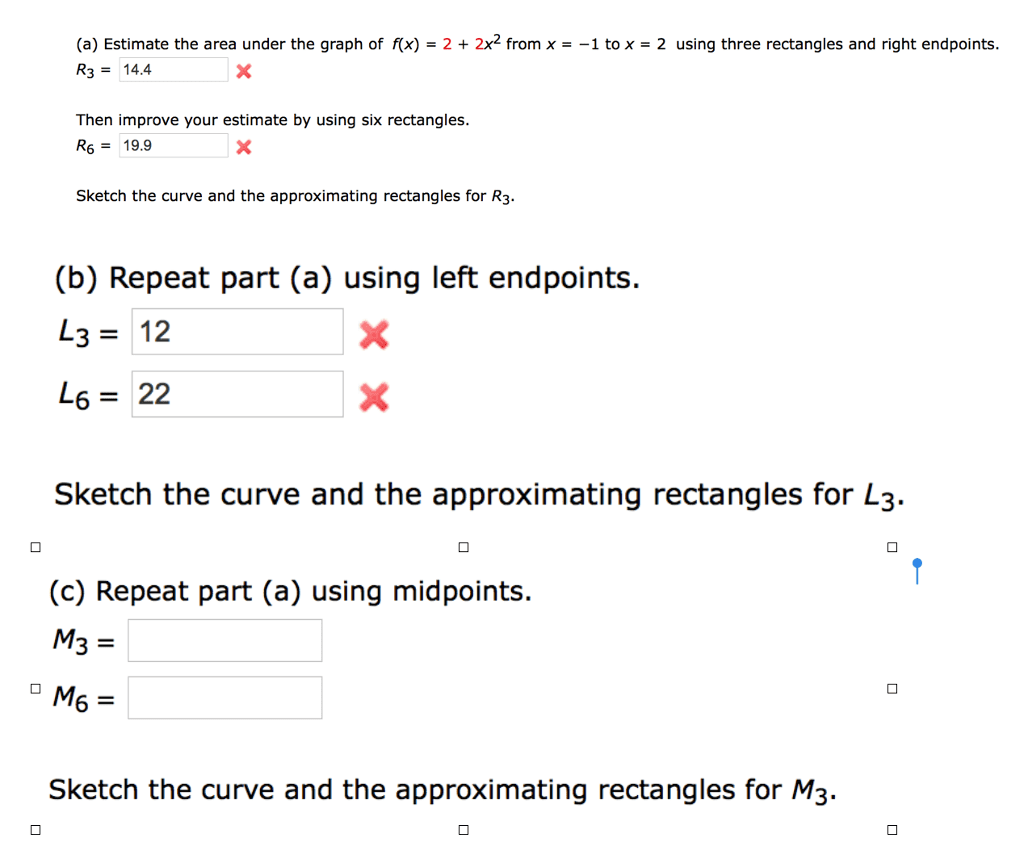
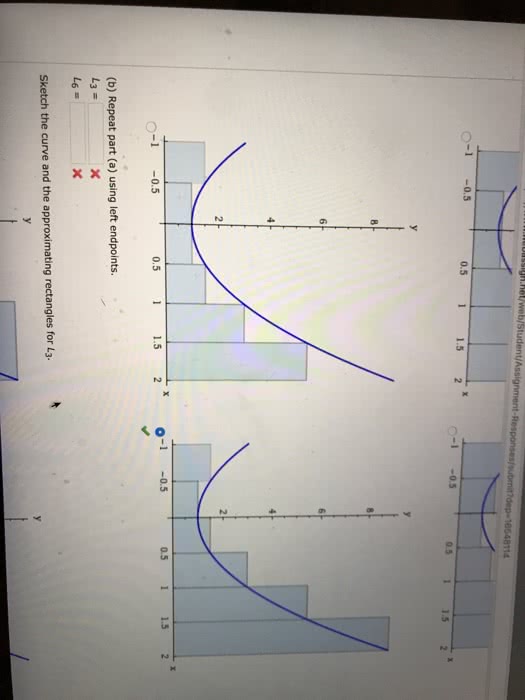
(a) Estimate the area under the graph of rx) = 2 + 2x2 from x =-1 to x = 2 using three rectangles and right endpoints. R314.4 Then improve your estimate by using six rectangles. R6 = 19.9 Sketch the curve and the approximating rectangles for R3 (b) Repeat part (a) using left endpoints. L3= 12 L6= 22 Sketch the curve and the approximating rectangles for L3. (c) Repeat part (a) using midpoints. M3 = Sketch the curve and the approximating rectangles for M3
Lelia LubowitzLv2
3 Jan 2019