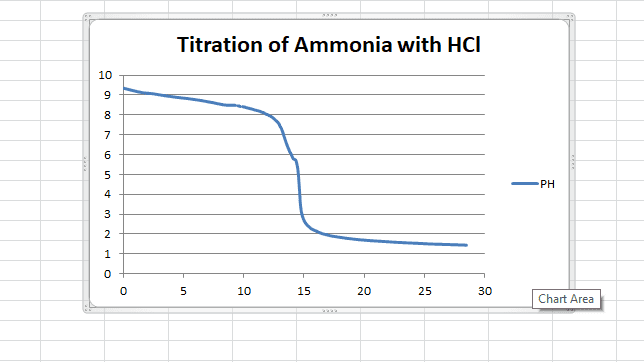
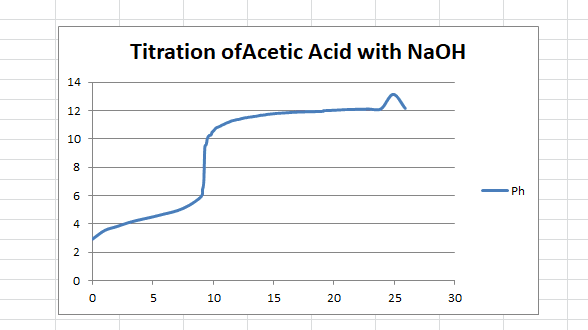
CALCULATIONS B. Titration of Acetic Acid with NaOH (Weak Acid-Strong Base Titration) 1. Using your titration curve, determine the volume of NaOH required to reach the equiv- alence point. Identify this volume and the equivalence point on your graph. Using your titration curve, determine the volume of NaOH solution required to reach 2. the half-equivalence point. Calculate the concentration, (M) of the diluted acetic acid solution. Calculate the concentration of the original acetic acid solution 3. 4. 5. Determine the pX, and K,for acectic acid. pK, C. Titration of Ammonia with HCI (Strong Acid-Weak Base Titration) 1. Using your titration curve, determine the volume of HCl required to reach the equiva- lence point. Identify the equivalence point on your graph. Calculate the concentration, (M), of the aqueous ammonia solution. Using your titration curve, determine the volume of HCI required to reach the half- 2. 3. equivalence point. 4. Determine the pK, and K, for the ammonium ion. 5. Determine the pK, and K, for ammonia. QUESTIONS 1. Write a brief paragraph comparing your two titration curves. You should discuss the similarities and differences between the components of the solutions at each of the fol- lowing points. You should write equations and use your data to support your answers. a. Between the initial pH and the equivalence point b. At the equivalence point c. Beyond the equivalence point Compare the similarities or differences of your curves along the x- and y-axis. 2. The accepted values for the pK, and Ka of acetic acid are 4.74 and 1.8 Ã 10-5 respec- tively. How do your experimentally determined values compare to the accepted va Percent error is a good way to make this comparison. 3. ues?
The equivalence point in the titration of 25.00 mL of acetic acid with 0.0987 M NaOH was determined to be 24.5 mL. What is the concentration of the acetic acid solution?