Topic: spectroscopy: examination of the absosorption spectrum and determination of the extinction coefficient for Flavin mononucleotide
2) in part 2 of the experiment, you are asked to prepare 5.0 mL of 2.0 x10⁻⁵M FMN starting with a 1.0 x 10 -4 solution of FMN? Calculate the amounts of 1.0 x 10⁻⁴ M FMN solution and water needed.
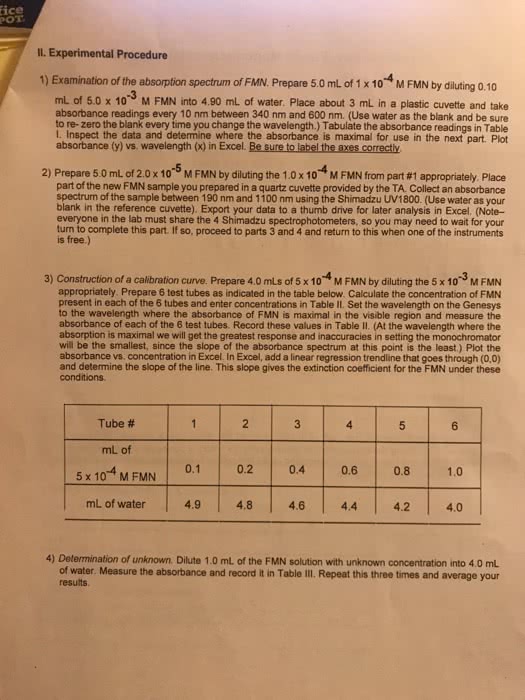
ice POT Il. Experimental Procedure 1) Examination of the absorption spectrum of FAIN. Prepare 5.0 mL of 1 x 10 4 MI FMN by luting 0 10 ml of 5.0 x 10³ M FMN into 4.90 mL of water. Place about 3 mL in a plastic cuvette and take absorbance readings every 10 nm between 340 nm and 600 nm. (Use water as the blank and be sure to re-zero the blank every time you change the wavelength.) Tabulate the absorbance readings in Table l. Inspect the data and determine where the absorbance is maximal for use in the next part. Plot absorbance (y) vs. wavelength (x) in Excel. Be sure to label the axes correctly 2) Prepare 5 0 mL of 2.0 x 10⁻⁵ M FMN by diluting the 1.0 x 10⁻⁴ M FMN from part #1 appropriately. Place part of the new FMN sample you prepared in a quartz cuvette provided by the TA Collect an absorbance spectrum of the sample between 190 nm and 1100 nm using the Shimadzu UV1800. (Use water as your blank in the reference cuvette). Export your data to a thumb drive for later analysis in Excel. (Note- everyone in the lab must share the 4 Shimadzu spectrophotometers, so you may need to wait for your turn to complete this part. If so, proceed to parts 3 and 4 and return to this when one of the instruments is free.) 3) Construction of a calilbration curve. Prepare 4.0 mls of 5x10⁴ M FMN by diluting the 5 x10³ M FMN appropriately. Prepare 6 test tubes as indicated in the table below. Calculate the concentration of FMN present in each of the 6 tubes and enter concentrations in Table II. Set the wavelength on the Genesys to the wavelength where the absorbance of FMN is maximal in the visible region and measure the absorbance of each of the 6 test tubes. Record these values in Table II. (At the wavelength where the absorption is maximal we will get the greatest response and inaccuracies in setting the monochromator will be the smallest, since the slope of the absorbance spectrum at this point is the least.) Plot the absorbance vs, concentration in Excel. In Excel, add a linear regression trendline that goes through (0,0) and determine the slope of the line. This slope gives the extinction coefficient for the FMN under these conditions. Tube # 6 mL of 5x 10⁴ M FMN0.1 02 04 0.6 0.8 1.0 4.9 48 4.644 42 4.0 mL of water 4) Determination of unknown. Dilute 1.0 mL of the FMN solution with unknown concentration into 4.0 ml of water. Measure the absorbance and record it in Table IlI Repeat this three times and average your results