1
answer
0
watching
544
views
12 Nov 2019
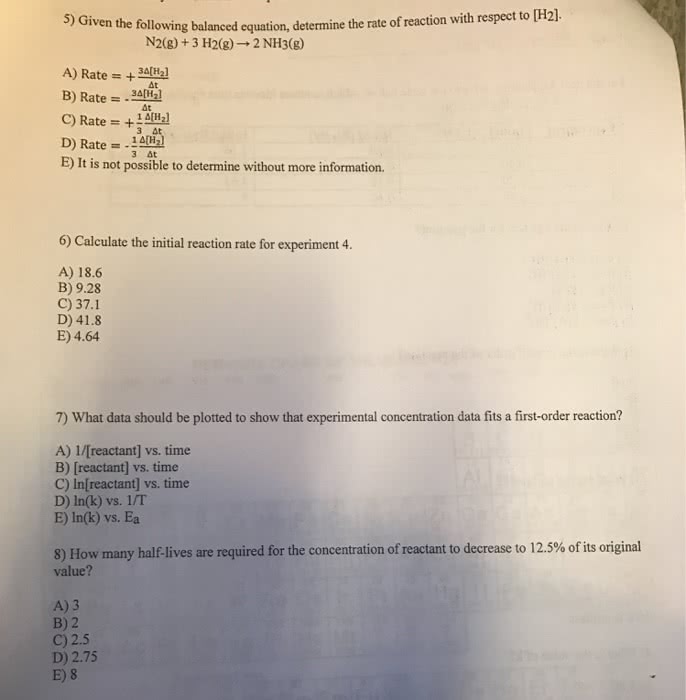
What data should be plotted to show that experimental concentration data fits a first-order reaction?
Question 4 options:
1/[reactant] vs. time, slope = k
[reactant] vs. time, y-intercept = 1/k
ln[reactant] vs. time, y-intercept = lnk
1/[reactant] vs. time,y-intercept = 1/k
ln[reactant] vs. time, slope = -k
The decomposition of AB has a rate constant of 1.70 Ã 10-3 s-1. If the initial concentration of AB is 1.56 M, what is the concentration of AB after 12.5 minutes?
What data should be plotted to show that experimental concentration data fits a first-order reaction?
Question 4 options:
| 1/[reactant] vs. time, slope = k | |
| [reactant] vs. time, y-intercept = 1/k | |
| ln[reactant] vs. time, y-intercept = lnk | |
| 1/[reactant] vs. time,y-intercept = 1/k | |
| ln[reactant] vs. time, slope = -k |
The decomposition of AB has a rate constant of 1.70 Ã 10-3 s-1. If the initial concentration of AB is 1.56 M, what is the concentration of AB after 12.5 minutes?

Nelly StrackeLv2
4 Sep 2019

Related textbook solutions

Basic Chemistry
5 Edition,
Timberlake
ISBN: 9780134138046

Principles of Chemistry Molecular Approach
4th Edition,
Tro
ISBN: 9780134112831

Chemistry: Structure and Properties
2nd Edition,
Tro
ISBN: 9780134293936

Principles of Chemistry Molecular Approach
3rd Edition, 2014
Tro
ISBN: 9780321971944

Chemistry: A Molecular Approach
3rd Edition,
Tro
ISBN: 9780321809247

Chemistry: A Molecular Approach
5th Edition,
Tro
ISBN: 9780134874371

Principles of Chemistry: A Molecular Approach
4th Edition,
Tro
ISBN: 9780134895741

Chemistry: The Central Science
14th Edition, 2017
Brown
ISBN: 9780134414232