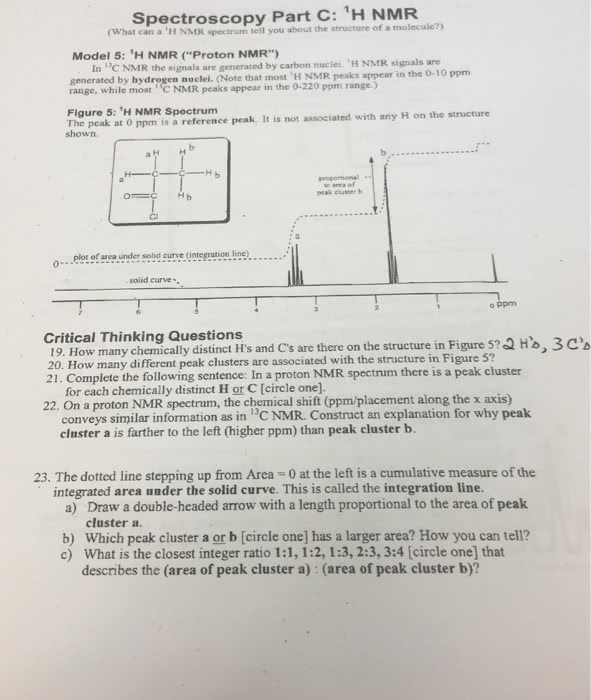
Spectroscopy Part C: 1H NMR (What can a 'H NMR spectrum tell you about the structure of a molecuie Model 5: 'H NMR ("Proton NMR") In C NM IR the signals are generated by carbon nuclei. 'H NMR signals are generated by hydrogen nuclel. (Note that most 'H NMR peaks appear in the 0-10 ppm range, while most NNIR peaks appear in the 0-220 ppm range.) Figure 5: 'H NMR Spectrum The peak at 0 shown. peak cluster b olot of eunder sold curve untegration line)... solid curveã o ppm Critical Thinking Questions 19. How many chemically distinct H's and C's are there on the structure in Figure 52Q H, 3C 20. How many different peak clusters are associated with the structure in Figure 5? 21. Complete the following sentence: In a proton NMR spectrum there is a peak cluster for each chemically distinct H or C [circle one] 22. On a proton NMR spectrum, the chemical shift (ppm/placement along the x axis) conveys similar information as in NMR. Construct an explanation for why peak cluster a is farther to the left (higher ppm) than peak cluster b. 23. The dotted line stepping up from Area 0 at the left is a cumulative measure of the integrated area uader the solid curve. This is called the integration line. Draw a double-headed arrow with a length proportional to the area of peak cluster a Which peak cluster a or b [circle one] has a larger area? How you can tell? What is the closest integer ratio 1:1, 1:2, 1:3, 2:3, 3:4 [circle one] that describes the (area of peak cluster a) : (area of peak cluster b)? a) b) c)