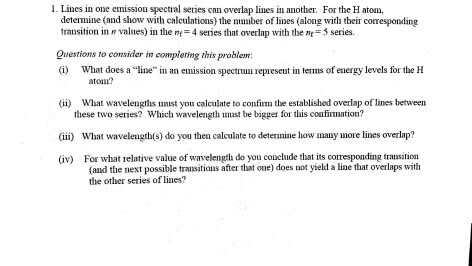
Lines in one emission spectral series can overlap lines in another. For the H atom, determine (and show with calculations) the number of lines (along with their corresponding transition in n values) in the n_f = 4 series that overlap with the n = 5 series. What does a "line" in an emission spectrum represent in terms of energy levels for the H atom? What wavelengths must you calculate to confirm the established overlap of lines between these two series? Which wavelength must be bigger for this confirmation? Whit wavelength(s) do you then calculate to determine how many more lines overlap? For what relative value of wavelength do you conclude that its corresponding transition (and the next possible transitions after that one) does not yield a line that overlaps with the other series of lines?