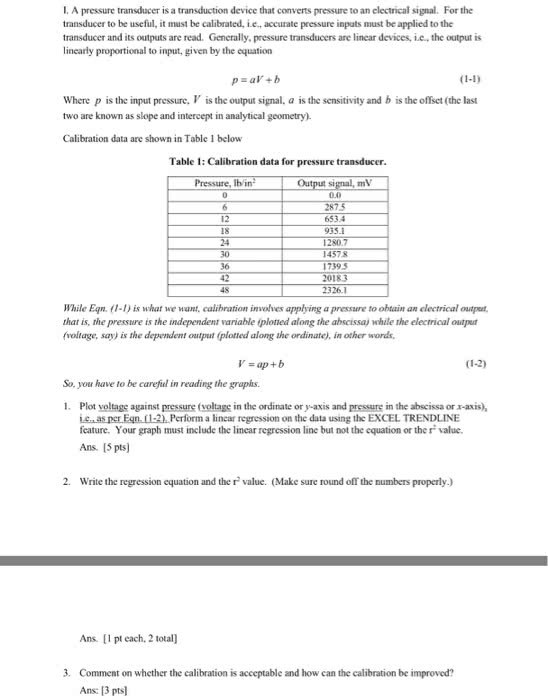
While Rqn (I - I) is what we want, calibration involves applying a pressure to obtain an electrical output, that is, the pressure is the independent variable (plotted along the abscissa), in other words. V = ap + b So, you have to be careful in reading the graphs. Plot voltage against pressure (voltage in the ordinate or y-axis and pressure in the abscissa or x-axis), i.e., as per Eqn.(1 - 2). Perform a linear regression on the data using the EXCEL TRENDLEINE feature. You graph must include the linear regression line but not the equation or the r^2 value. Write the regression equation and the r^2 value. (Make sure round of the numbers properly.) Comment on whether the calibration is acceptable and how can the calibration be improved?
1. Click on the Excel icon. A series of rows and columns will appear.
Column A corresponds to the x-axis and Column B corresponds to the y-axis.
Enter the values for the x- and y- axes in columns A and B, respectively.
Position the cursor on the first cell, click and hold down the left mouse button and highlight all the values of columns A and B you have entered.
Click on the chart wizard (an icon that looks like a bar graph).
Click on scatter, next, and then click on the second sub choice. Click on next.
Click on next.
Your graph should show up on the screen. Click on next.
Click on chart title. Type in the title of your graph followed âby your nameâ. Label the x- and y-axes by placing a name with units in the space given for Category x and Value y.
Click on gridlines. Click on minor gridlines for both the x- and y-axes. Click on next.
You are given a choice between saving as a new sheet or saving in the current sheet. Saving as a new sheet will produce a larger picture of the graph, while saving within the current sheet allows for both the data sheet and graph to be printed on the same page. Click as a new sheet and the click finish.
If there is a lot of empty space on your graph, you need to adjust the scale on the x- and y-axes. To do this, double click on the axis you wish to adjust. The number that you will be changing appears in the âminimumâ box. (Note: the value at the origin does not necessarily need to be zero.
To print the graph, click on file and then click on print.
GRAPHING EXERCISE #2
Use this data in the following exercises.
Time, min Mass, g Time, min Mass,g
0.0 8.860 6.0 8.765
1.0 8.844 7.0 8.748
2.0 8.828 8.0 8.734
3.0 8.814 9.0 8.719
4.0 8.796 10.0 8.703
5.0 8.782
1. Using Excel, graph the time and mass data as in #1. Using the linear regression feature on excel, determine the equation of a line and show that equation on your graph.
2. Answer the following questions using the graph you have created above.
What is the independent variable?
What item is plotted on the abscissa?
What would be the mass of acetone in grams at a time of 12 minutes?
What would be the mass of acetone in grams at a time of 4.6 minutes? Show two ways to find this value.