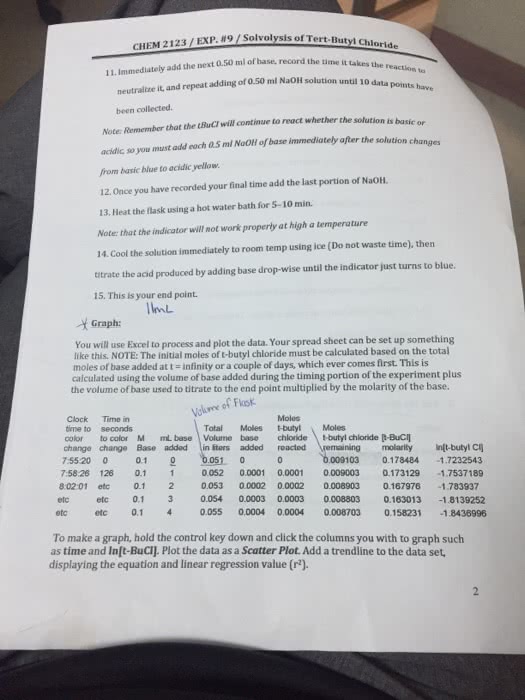
How to calculate remaining moles of t-butyl chloride
Immediately add the next 0.50 ml of base, record the time it takes the reaction to neutralize it, and repeat adding of 0.50 ml NaOH solution until 10 data points have been collected. Owner you have recorded your final time add the last portion of NaOH. Heat the flask using a hot water bath for 5-10 min. Cool the solution Immediately to room temp using ice (Do not waste time), then titrate the acid produced by adding base drop-wise until the indicator Just turns to blue. This is your end point. You will use Excel to process and plot the data. Your spread sheet can be set up something like this. The Initial moles of t-butyl clone must be calculated based on the total moles of base added at t = infinity oar couple of days, whichever comes first. This is calculated using the volume of base added during the timing portion of the experiment plus the volume of base used to titrate to the end point multiplied by the molarity of the base. To make a graph, hold the control key down and click the columns you with to graph such as time and ln(t-BuCl]. Plot the data as a Scatter Plot Add a trendline to the data set. displaying the equation and linear regression value (r^2).