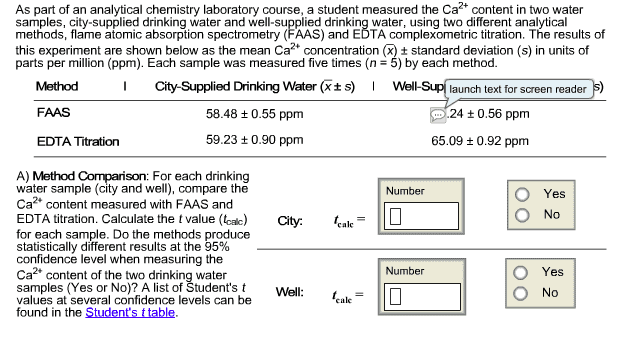
As part of an analytical chemistry laboratory course, a student measured the Ca content in two water samples, city-supplied drinking water and well-supplied drinking water, using two different analytical methods, flame atomic absorption spectrometry (FAAS) and EDTA complexometric titration. The results of this experiment are shown below as the mean Ca concentration (X t standard deviation (s) in units of parts per million (ppm). Each sample was measured five times (n E5) by each method. I City Supplied Drinking Water (Xts) l Well- aunch text for screen reader s) Method FAAS 58.48 0.55 ppm 24 :t 0.56 ppm 59.23 t 0.90 ppm 65.09 0.92 ppm EDTA Titration A) Method Comparison: For each drinking water sample (city and we compare the Number O Yes Ca content measured with FAAS and O No EDTA titration. Calculate the tvalue (toalc) City: for each sample. Do the methods produce statistically different results at the 95% confidence level when measuring the Number O Yes Ca content of the two drinking water samples (Yes or No)? A list of Student's t well: O No values at several confidence levels can be found in the Student's ttable.