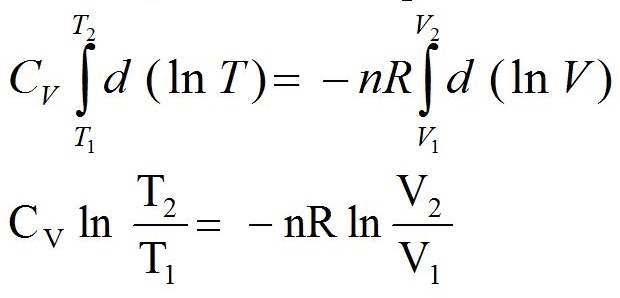
1. Equation shows the relation between T and V when an ideal gas is adiabatically and reversiblyexpanded or compressed from T1V1 to T2V2,
a) Prepare a table in an Excel spreadsheet showing the values of V, T, and p (i.e., three columns) when 200 g. CH4(g) is reversibly and adiabatically expanded starting at T1 = 350K, V1 = 0.010 m3 to a final volume of 200 L. Assume ideal gas behaviour. Needed heat capacity data can be found in the Lecture Notes Appendix.
In the first column, use values of V starting from V1 = 0.010 m3 to 200 L (0.200 m3) in steps of 0.010 m3 . In column 2 calculate each new T (eq. 2.42) and in column 3 the corresponding new pressure. Remember eq. 2.29.
b) Next prepare two separate graphs, one of T (y-axis) vs. V (L or m3, your choice) and one of p (y-axis) against V using the values from the columns in a). Present your table and graphs on the same page. Make sure your graphs include a title for each, axis legends (x-values V (m3), y-values T (K) or p (Pa).
T. CIT | d (In T)--nR | d (In V) T. c, In-_ = ã¼ã¼ã¼nR ln-Y2 V (T_T 2e in
First, make a calibration curve using only the area of the ethanol peak and the concentrations of the standards. As in Part 1 a and b, prepare and print a calibration curve including the linear least squares equation of the line equation and the R2 value, and print a copy for your report. Also, calculate the concentration of your sample and the uncertainty (95% confidence interval), as well as the uncertainty of the unknown determination on a percentage basis, and include these values in your report. .
Next, make a calibration curve based on the ratio of ethanol area to propanol area and the concentrations of the standards. As in the previous question, prepare and print a calibration curve including the linear least squares equation of the line equation and the R2 value, and print a copy for your report. Also, calculate the concentration of your sample and the uncertainty (95% confidence interval), as well as the uncertainty of the unknown determination on a percentage basis, and include these values in your report. .
At a blood alcohol concentration of 0.08% (w/v) or more a person is considered impaired. Briefly discuss whether the calculated results for the sample in e and f above support criminal charges of impairment.
Report Requirements:
Spreadsheet with graphs and calculations. Prepare separate sheets in one excel file for each of the following:
Data Set 1
Data Set 2
Calibration with external standard
Standard addition with one standard (optional, could submit hand or type written calculation only)
Standard addition with multiple additions
Internal standard peak areas
Internal standard peak area ratios
Print-outs of graphs
Data Set 1
Data Set 2
Calibration with external standard
Standard addition with multiple additions
Internal standard peak areas
Internal standard peak area ratios
Results
Fill in the table below with results from the spreadsheet. Remember to include units.