0
answers
0
watching
123
views
19 Nov 2019
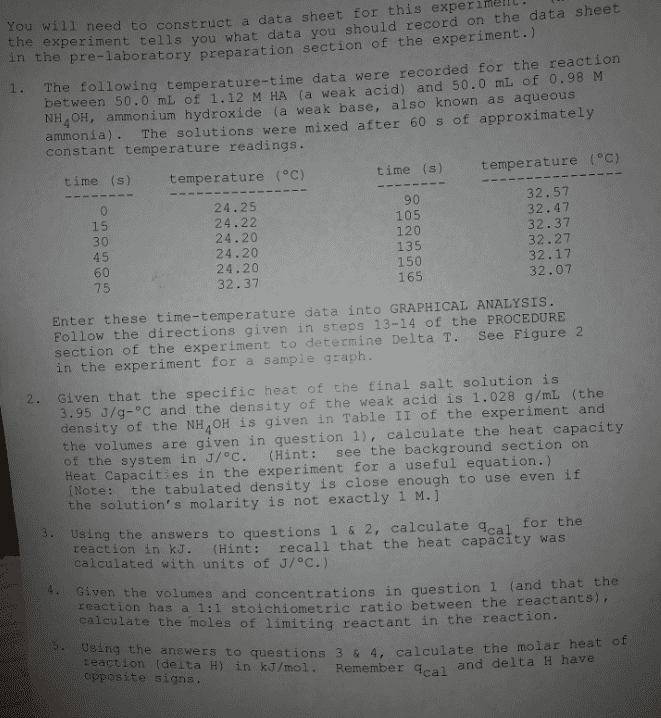
You will need to construct a data sheet for this experimell. data sheet e experiment tells you what data you should record on the n the pre-laboratory preparation section of the experiment .) . The following temperature-time data were recorded for the reaction between 50.0 mL of 1.12 M HA (a weak acid) and 50.0 ml of.98 NH4OH, ammonium hydroxide (a weak base, also known as aqueous ammonia). The solutions were mixed after 60 s of approximately constant temperature readings time (s) temperature (°C) time (s) temperature (°c) 15 30 45 60 75 24.25 24.22 24.20 24.20 24.20 32.37 90 105 120 135 150 165 32.57 32.47 32.37 32.27 32.17 32.07 Enter these time-temperature data into GRAPHICAL ANALYSIS. Follow the directions given in steps 13-14 of the PROCEDURE section of the experiment to determine Delta T. See Figure 2 in the experiment for a sample graph 2. Given that the specific heat of the final salt solution is 3.95 J/g-°C and the density of the weak acid is 1.028 g/mL (the density of the NH40H is given in Table II of the experiment and the volumes are given in question 1), calculate the heat capacity of the system in J/oC.(Hint: see the background section orn Heat Capacities in the experiment for a useful equation.) Note: the tabulated density is close enough to use even if the solution's molarity is not exactly 1 M.] 3. Using the answers to questions 1&2, cal culate qca for the reaction in kJ. (Hint: recal1 that the heat capacity was calculated with units of J/°c.) 4. Given the volumes and concentrations in question 1 (and that the reaction has a 1:1 stoichiometric ratio between the reactants), alcula te the moles of 1imiting reactant in the reaction. Using the answers to questions 3 & 4, calc reaction (delta H) in kJ/mol. Remember cal an opposite signs ulate the molar heat of delta H have