I need some help filling out this chart information! Thank you.
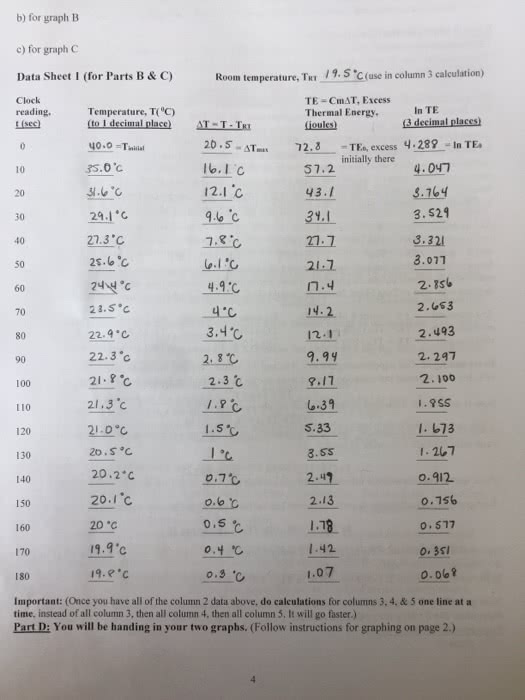
b) for graph B c) for graph C Data Sheet 1 (for Parts B & C) Room temperature TRT 13. Scouse in column 3 calculation) TE Cm AT, Excess Clock Thermal Energy, In TE Temperature, T( C) reading decimal places) o I decimal place) AT T TRI AT 12.8 TEe, excess 4.289 n TE. 20 S initially there 4.047 57.2 12.I 'c. 43.1 8.164 20 3. S24 30 3.321 2.3 C 40 3.011 4.9 14 2.493 22.4 80 2.297 22.3 c 9.94 2.100 2.3 9.17 21.3 c I. Rss 1.673 S. 33 20 20.S °C. 1.207 30 20.2 C. o.156 20 2.13 20 "C 0, S77 19.9 c 1.42 0.4 0,3si 70 80 Important: (Once you have all of the column 2 data above, do calculations for columns 3, 4. & 5 one line at a time, instead of all column 3, then all column 4, then all column 5. It will go faster.) Part D: You will be handing in your two graphs. (Follow instructions for graphing on page 2.)