(1)
(2)
(3)
(4)
(5)
(6)
(7)
Output (Q)
Price per Unit
(P)
Total Revenue (TR)
Marginal Revenue (MR)
Total Cost (TC)
Average Total Cost (ATC)
Marginal Cost (MC)
0
$10
$8
1
9
11
2
8
12
3
7
15
4
6
24
5
5
35
6
4
48
Does this data represent the revenues and costs of a perfect competitive firm or a firm with some degree of âmonopoly powerâ? ______________________
How do you know? ________________________________________________
Fill in the blanks in the table above.
How much output should this firm produce to maximize itâs profit? _____units. What price should this firm charge for its product? $_____ per unit.
This choice of output and price will lead to an economic profit = $______
| (1) | (2) | (3) | (4) | (5) | (6) | (7) |
| Output (Q) | Price per Unit (P) | Total Revenue (TR) | Marginal Revenue (MR) | Total Cost (TC) | Average Total Cost (ATC) | Marginal Cost (MC) |
| 0 | $10 | $8 | ||||
| 1 | 9 | 11 | ||||
| 2 | 8 | 12 | ||||
| 3 | 7 | 15 | ||||
| 4 | 6 | 24 | ||||
| 5 | 5 | 35 | ||||
| 6 | 4 | 48 |
Does this data represent the revenues and costs of a perfect competitive firm or a firm with some degree of âmonopoly powerâ? ______________________
How do you know? ________________________________________________
Fill in the blanks in the table above.
How much output should this firm produce to maximize itâs profit? _____units. What price should this firm charge for its product? $_____ per unit.
This choice of output and price will lead to an economic profit = $______

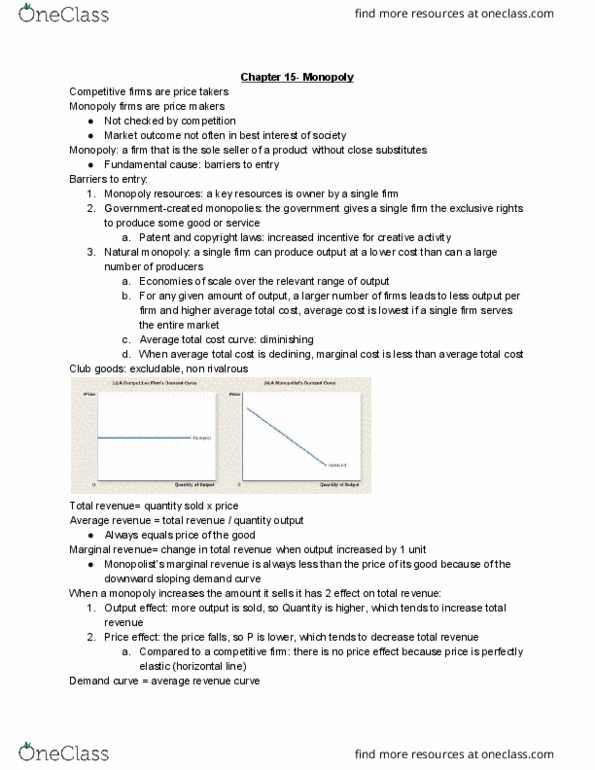
Related textbook solutions


Related questions

Suppose that a monopolistic competitive firm must build a production facility in order to produce a product. The fixed cost of this facility is FC = $24. Also, the firm has a constant marginal cost, MC = $3. Demand for the product that the firm produces is given by P = 27-3Q.
a) Fill in the table below.
| Quantity of Output | Price | Total Cost | Average Total Cost | Total Revenue | Profits |
|---|---|---|---|---|---|
| 1 | |||||
| 2 | |||||
| 3 | |||||
| 4 | |||||
| 5 | |||||
| 6 | |||||
| 7 | |||||
| 8 | |||||
| 9 |
b) How much output will this firm produce if it maximizes profit?
c) What price should this firm charge if it wants to maximize profit?