0
answers
0
watching
114
views
27 Nov 2019
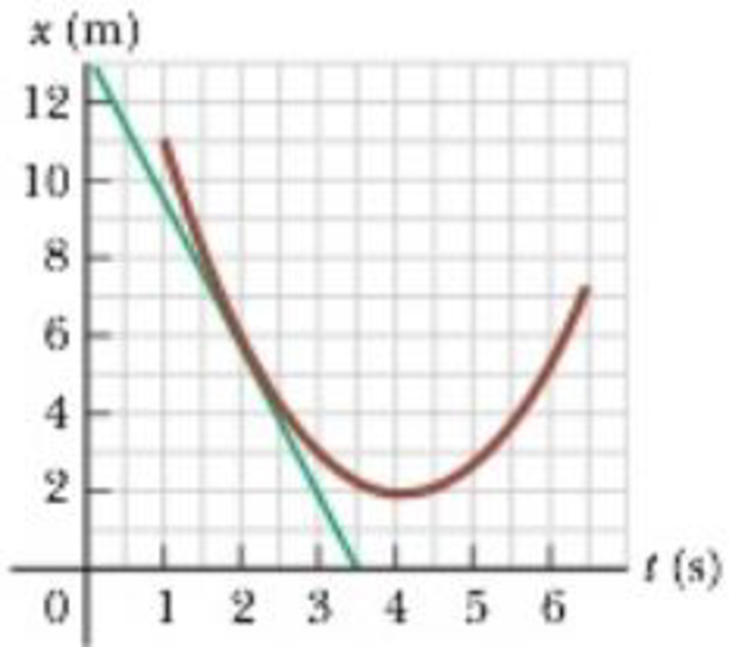
A position-time graph for a particle moving along the x axis isshown in the figure. The divisions along the horizontal axisrepresent 1.00 s and the divisions along the vertical axisrepresent 5.0 m.
(a) Find the average velocity in the time interval t = 3.00 s to t= 8.00 s.
(b) Determine the instantaneous velocity at t = 4.00 s (where thetangent line touches the curve) by measuring the slope of thetangent line shown in the graph.
(c) At what value of t is the velocity zero?