1
answer
0
watching
224
views

6 Oct 2020
A position-time graph for a particle moving along the x-axis is shown in Figure P2.5. (a) Find the average velocity in the time interval t = 1.50 s to t = 4.00 s. (b) Determine the instantaneous velocity at t = 2.00 s by measuring the slope of the tangent line shown in the graph. (c) At what value of t is the velocity zero?
Figure P2.5
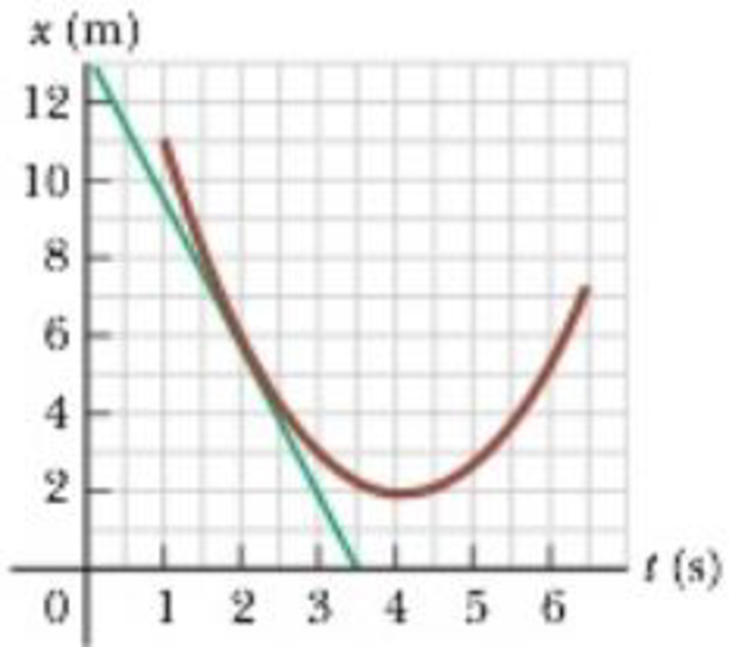

Tauseef ShaikhLv10
13 Nov 2020


