1
answer
0
watching
1,210
views

11 Dec 2019
The figure shows angular position versus time graphs for six different objects.
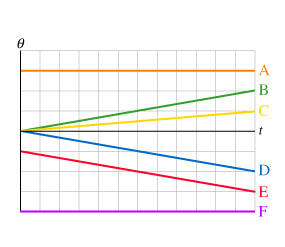
a) Rank these graphs on the basis of the angular velocity of each object. Rank positive angular velocities as larger than negative angular velocities. Rank from largest to smallest. To rank items as equivalent, overlap them.
b) Rank these graphs on the basis of the angular acceleration of the object. Rank positive angular accelerations as larger than negative angular accelerations. Rank from largest to smallest. To rank items as equivalent, overlap them.
The figure shows angular position versus time graphs for six different objects.
a) Rank these graphs on the basis of the angular velocity of each object. Rank positive angular velocities as larger than negative angular velocities. Rank from largest to smallest. To rank items as equivalent, overlap them.
b) Rank these graphs on the basis of the angular acceleration of the object. Rank positive angular accelerations as larger than negative angular accelerations. Rank from largest to smallest. To rank items as equivalent, overlap them.

Supratim PalLv10
20 Oct 2020