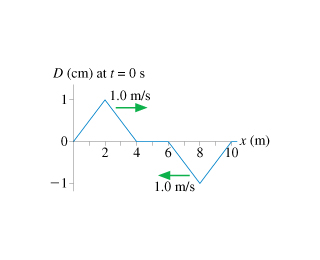
(a) is a snapshot graph at t = 0 s of two waves approaching each other at 1.0 m/s.
For unlimited access to Homework Help, a Homework+ subscription is required.
(Figure 1) is a snapshot graph at t = 0 s of two waves approaching each other at 1 m/s. Draw a history graph of the point of the string at x = 4 m.
Given below is a snapshot graph at t = 0 s of two waves on a string approaching each other at 1 m/s. List the values of the displacement of the string at x = 4.0 cm at 1 s intervals from t = 0 s to t = 6 s.
The left is a snapshot graph of two wave pulses on the string approaching one another.
A) at what time t does the snapshot graph on the right show? Explain.
B) draw a history graph of the string at x = 4m for time t interval 0s to 4s.