1
answer
0
watching
168
views

6 Oct 2020
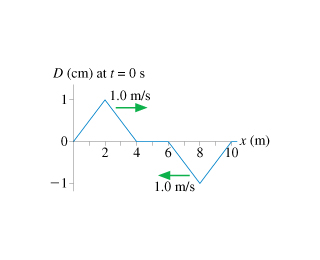
(Figure 1) is a snapshot graph at t = 0 s of two waves approaching each other at 1 m/s. Draw a history graph of the point of the string at x = 4 m.

(Figure 1) is a snapshot graph at t = 0 s of two waves approaching each other at 1 m/s. Draw a history graph of the point of the string at x = 4 m.


Rochelle EnreraLv10
5 Jan 2021