A graph of position versus time for a certain particle moving along the x-axis is shown in Figure P2.6. Find the instantaneous velocity at the instants .
For unlimited access to Homework Help, a Homework+ subscription is required.
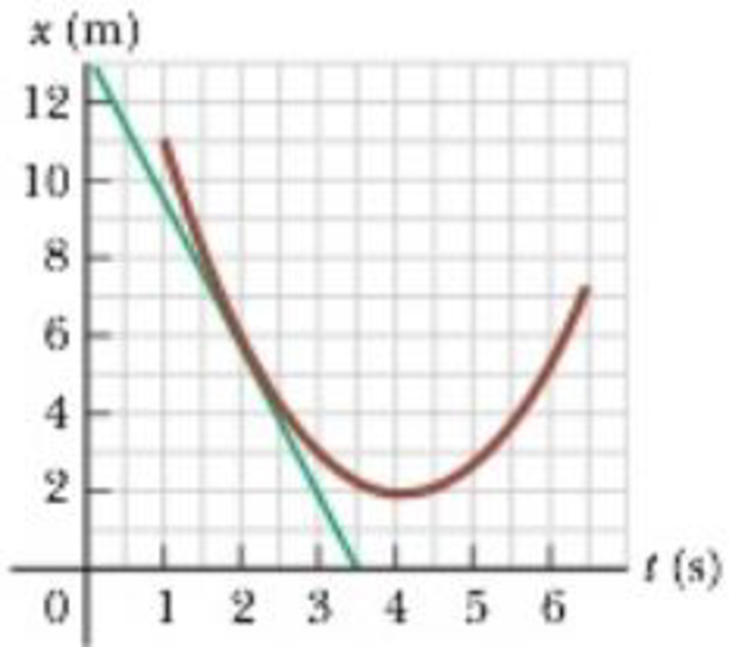
A position-time graph for a particle moving along the x-axis is shown in the figure below. (a) Find the average velocity in the time interval to (b) Determine the instantaneous velocity at by measuring the slope of the tangent line shown in the graph. (c) At what of t is the velocity zero?
A position-time graph for a particle moving along the x-axis is shown in Figure P2.5. (a) Find the average velocity in the time interval t = 1.50 s to t = 4.00 s. (b) Determine the instantaneous velocity at t = 2.00 s by measuring the slope of the tangent line shown in the graph. (c) At what value of t is the velocity zero?
Figure P2.5
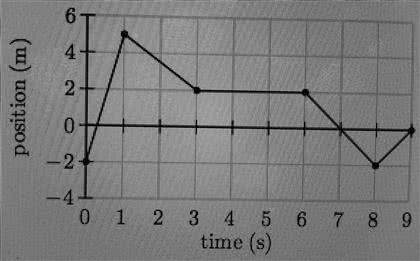
The position versus time for a certain object moving along the x-axis is shown. The object's initial position is -2 m.
(a) Find the instantaneous velocity at 0.5 s. Answer in units of m/s.
(b) Find the instantaneous velocity at 2 s. Answer in units of m/s.
(c) Find the instantaneous velocity at 4.5 s. Answer in units of m/s.
(d) Find the instantaneous velocity at 8.5 s. Answer in units of m/s.