1
answer
0
watching
105
views

6 Oct 2020
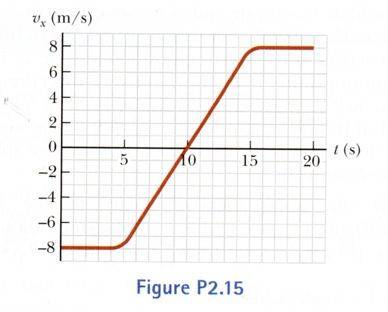
A velocity-time graph for an object moving along the x-axis is shown in Figure P2.15.
(a) Plot a graph of the acceleration versus time.
Determine the average acceleration of the object
(b) In the time interval t=5.00 s to t=15.0 s and
(c) in the time interval t=0 to t = 20.0 s.
A velocity-time graph for an object moving along the x-axis is shown in Figure P2.15.
(a) Plot a graph of the acceleration versus time.
Determine the average acceleration of the object
(b) In the time interval t=5.00 s to t=15.0 s and
(c) in the time interval t=0 to t = 20.0 s.

VikasLv10
10 Dec 2020


