MATH 2565 Lecture Notes - Histogram, Quartile, Box Plot

10 Jan 2013
School
Department
Course
Professor
Document Summary
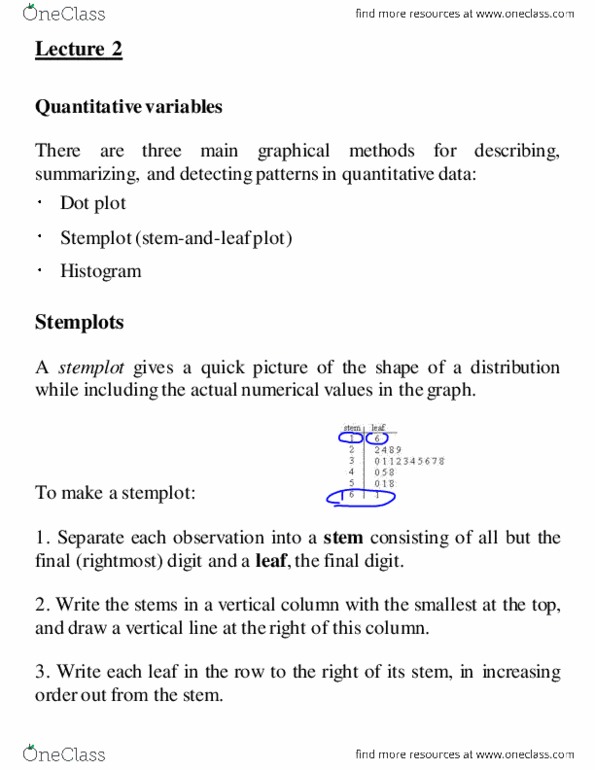
= (57 + 63 + 63 + 57 + 61+63+48+69+66+64)/10 = 61. 1. (a) all five year old children. (b) m (c) no. Sample is small. x i n: mtb > hist c1. 10 1 * (a) left skewed. (b) 1 (c) lcb= 7. 5, ucb= 8. 5. 1 5 0 (cid:229: mtb > stem c1. 1 13 0 (a) lu= 1, su=10 (b) increment=5. 48. 0 52. 0 56. 0 60. 0 64. 0 68. 0 (c) q1 1. 5*iqr = 48, q3 + 1. 5*iqr = 73. Minimum value in the sample is not smaller than 48 and the maximum value in the sample is not bigger than 73. Therefore there are no probable or possible outliers: mtb > boxp c1. ** * --------i + i--- * * o o o. 8. 0 16. 0 24. 0 32. 0 40. 0 48. 0 (a) sp= (16-8)/10=. 8; median = 16+(5)(. 8)=20 (b) first quartile= 18. 4 (c) third quartile= 22. 4 (d) possible outliers= 8, 8. 8, 10. 4, 28. 8, 30. 4; probable outliers= 35. 2, 40,