Biology 2581B Study Guide - Erwin Chargaff, Oswald Avery, Martha Chase

Document Summary
Get access

Related Documents
Related Questions
GENETICS QUESTION: For this experiment we focused on forward genetics: First, his- mutants were identified and then complementation analysis was used in order to determine which of the 7 his genes was mutated. ( The exact data can be seen at the bottom). In this experiment we screened for his- mutants that were generated via a random mutation process resulting from errors in DNA replication or induced by EMS aka Ethyl methanesulfonate. We compared a mutagenized culture that was treated with EMS and an un-mutagenized culture that was not treated with EMS. However, both cultures went trhough an enrichment process to increase the frequency of his- mutants.
Point mutations involve the substitution of one type of base pair for another. If the substitution replaces a purine with a purine (or a pyrimidine with a pyrimidine), it is called a transition. If the substitution replaces a purine with a pyrimidine (or a pyrimidine with a purine), it is called a transversion. Many mutagenic chemicals cause this type of mutation by alkylation of a nucleotide base. The chemically altered base can then be misread during replication or repair. For example the mutagen, ethyl methanesulfonate (EMS), adds an ethyl (-CH2-CH3) group to both guanine or thymine bases causing the modified guanine to pair with thymine and the modified thymine to pair with guanine.
1. Why might one gene be more susceptible to EMS mutagenesis than another gene?
2. Why might we have expected to find a higher frequency of polar mutants (his4A-B-C-) in the unmutagenized culture compared to the mutagenized culture?
| Table 2. Experiment 1B class data summary (number of his-mutants by section) Unmutagenized | |||||||||||
| Section | 1 | 2 | 3 | 4ABC | 4A | 4B | 4C | 5 | 6 | 7 | Total his- mutants |
| Tuesday | 7 | 1 | 5 | 4 | 2 | 1 | 9 | 2 | 3 | 1 | 35 |
| Wednesday | 2 | 1 | 14 | 0 | 4 | 2 | 2 | 4 | 8 | 2 | 39 |
| Total | 9 | 2 | 19 | 4 | 6 | 3 | 11 | 6 | 11 | 3 | 74 |
| % each mutant | 12.1 | 2.7 | 25.7 | 5.4 | 8.1 | 4.1 | 14.9 | 8.1 | 14.9 | 4.1 | ~100% |
| Mutagenized | |||||||||||
| Section | 1 | 2 | 3 | 4ABC | 4A | 4B | 4C | 5 | 6 | 7 | Total his- mutants |
| Tuesday | 2 | 5 | 4 | 2 | 6 | 5 | 5 | 0 | 4 | 1 | 34 |
| Wednesday | 9 | 1 | 15 | 0 | 9 | 1 | 2 | 2 | 9 | 4 | 52 |
| Total | 11 | 6 | 19 | 2 | 15 | 6 | 7 | 2 | 13 | 5 | 86 |
| % each mutant | 12.8 | 7.0 | 22.1 | 2.3 | 17.4 | 7.0 | 8.1 | 2.3 | 15.1 | 5.8 | ~100% |

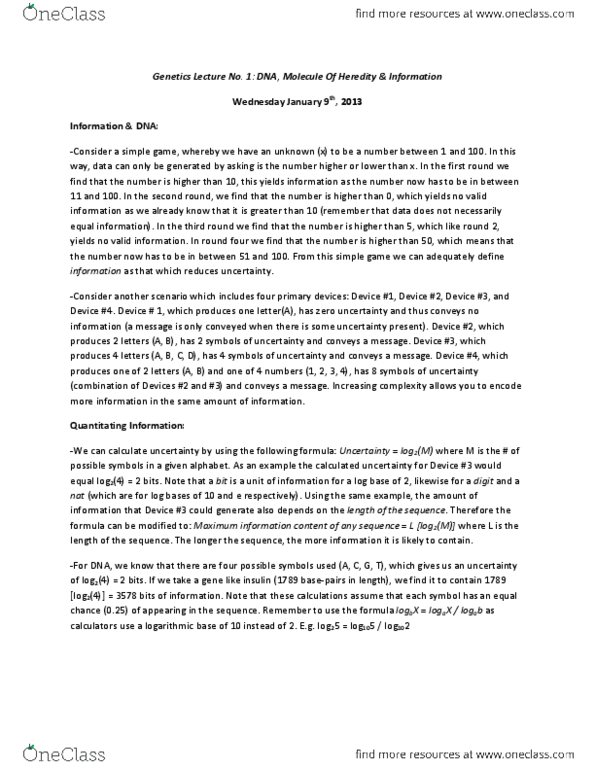
Introduction: A Chi-square test is used to compare observed data with expected data according to a hypothesis. For instance, if you were crossbreeding 2 heterozygous pea plants, you would expect to see a 3:1 phenotypic ratio in the offspring. In this case, if you were to breed 400 pea plants, you would expect to see 300 plants showing the dominant trait and 100 showing the recessive trait. But what happens if you observe only 260 plants with the dominant trait and 140 plants with the recessive trait? Does this mean something is wrong with Mendelian genetics or is this difference in expected results just due to chance (random sampling error)? These are the questions that can be answered using Chi-square statistics. The results of this statistical test is used to either reject or accept (fail to reject) the null hypothesis. The null hypothesis states there is no significant difference between the observed results and the expected results. This means that if the null hypothesis is accepted, the difference in observed and expected results was just a matter of chance and so the observed results basically "fit" with what was expected. Degrees of freedom (df) = number of independent outcomes (Y) being compared less 1 df = Y-1 At the 95% confidence interval we are 95% confident that there is a significant difference between the observed and expected results, therefore rejecting the null hypothesis. Probability Value - Is the decimal value determined from the X2 table and is the probability of accepting the null hypothesis. A 0.05 probability value equates to a 95% confidence interval.
The Chi-squared test formula is: Example: If we cross two pea plants that are heterozygous yellow pods, we would expect a 3:1 phenotypic ratio. So let's say we actually did the cross and got 280 plants with green pods and 120 plants with yellow pods. Question: Is this a 3:1 phenotypic ratio? This is the value of Chi-squared Test. We have a total of 400 plants and we expect a 300 green:100 yellow phenotypic ratio If the calculated Chi-squared value is less than the critical value listed in the Chi-squared table, then we accept the null hypothesis. This means that there is no significant difference between the observed and the expected values. Our degrees of freedom (df) = 2 outcomes - 1, or df = 1. Now we go the X2 table below and using the df = 1 and probability value of 0.05, our critical value is 3.84. Since our calculated X2 value is 5.33, and is larger than the critical value, we reject the null hypothesis and can say (at 95% confidence) that there is a significant difference between our observed and expected values.
The parent generation is yellowed podded and green podded pea plants. You cross a yellow podded pea plant with a green podded pea plant and you get 100% yellow podded plants in the F1 Generation (Phenotypic ratio 4 : 0, yellow to green). What will be the expected phenotypic ratio when you allow the F1 generation to reproduce?
Fill out the Punnett square.
If we actually did the cross and got 1150 yellow and 350 green. Would this be a consistent with what was expected?
Learning Outcomes Questions
1. Why would you run a Chi-squared test?
| To determine if our data is consistent with expected results. | ||
| a To determine if our data is consistent with expected results. b To determine if our data exactly matches the expected results. | ||
| c To determine the expected results. | ||
| d | To compare the phenotypic ratios to the genotypic ratios. |
2. Determine the degrees of Freedom of the phenotypic ratio for this genetic cross.
a. 1
b. 2
c. 3
d. 4
e. 5
3. Using the data given, what is the result of your Chi-squared analysis? x2= ___.
| a. | 2.22 | |
| b | 2.71 | |
| c | 4.36 | |
| d | 187.78 | |
| e | 448.27 |
4. Using the results of your Chi-squared analysis, do we fail to reject or reject the null hypothesis?
| a. | Fail to reject the null | |
| b. | Reject the null | |
| c. | It cannot be determined from the data given |
