ANTA01H3 Study Guide - Breakfast Cereal, Interquartile Range, Calorie

Document Summary
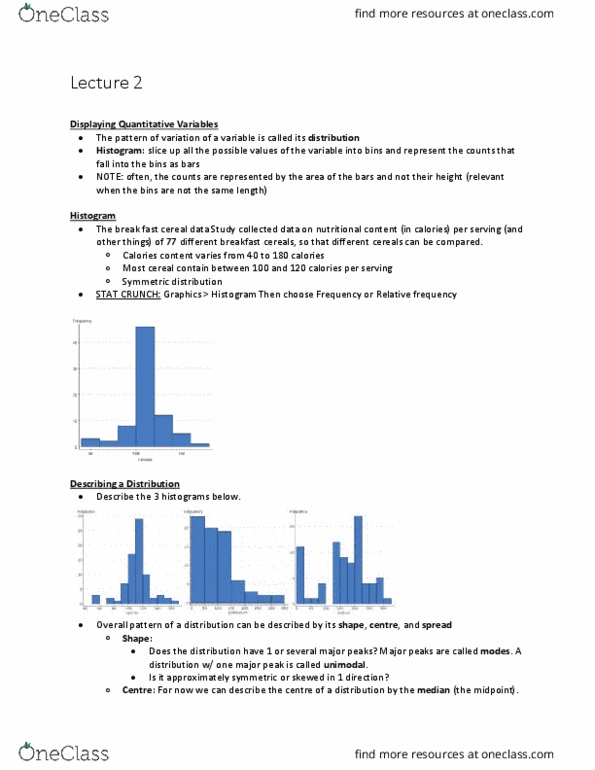
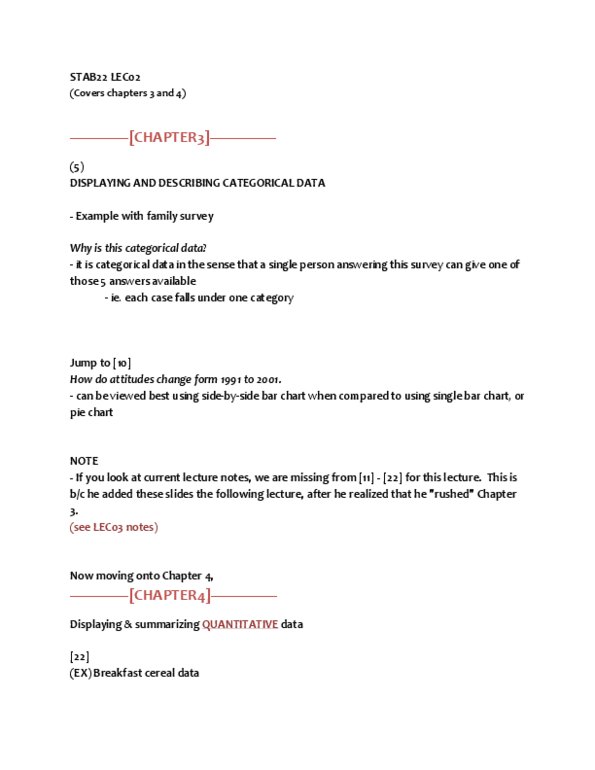
Chapter 4: displaying and summarizing quantitative data p49. The pattern of variation of a variable is called its distribution. Study collected data on nutritional content per serving (and other things) of 77 different breakfast cereals, so that different cereals can be compared. Calorie content varies from 30 to 180. Most cereals have between 100 and 120 calories/serving. A few have a lot more or a lot less, but only a few. Shape symmetric: falls away from peak about same both sides. In any graph of data, look for the overall pattern and for striking deviations from that pattern (e. g gaps. Overall pattern of a distribution can be described by its shape, centre, and spread. An important kind of deviation is an outlier, an individual value that falls outside the overall pattern. For now we can describe the centre of a distribution by the median (the midpoint) Some other things to look for in describing shape are: