PSY201H1 Chapter Notes - Chapter 3: Percentile Rank, Bar Chart, Frequency Distribution


Document Summary
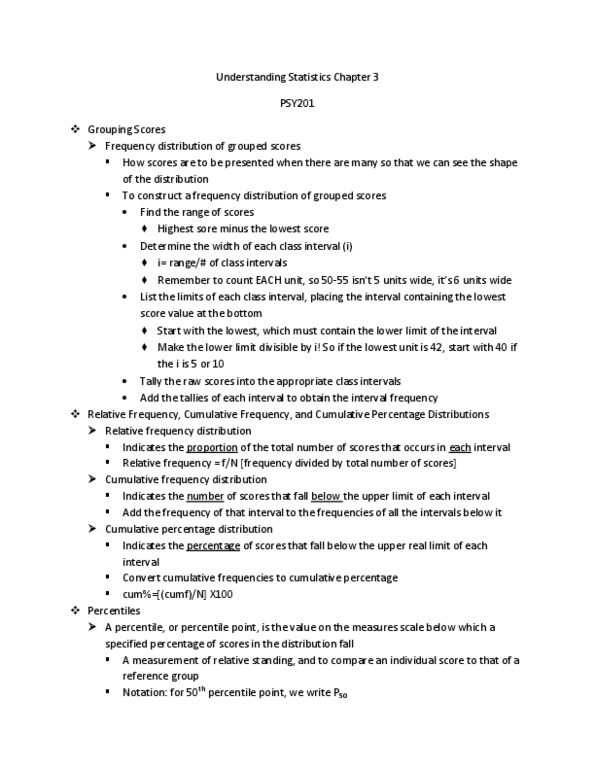
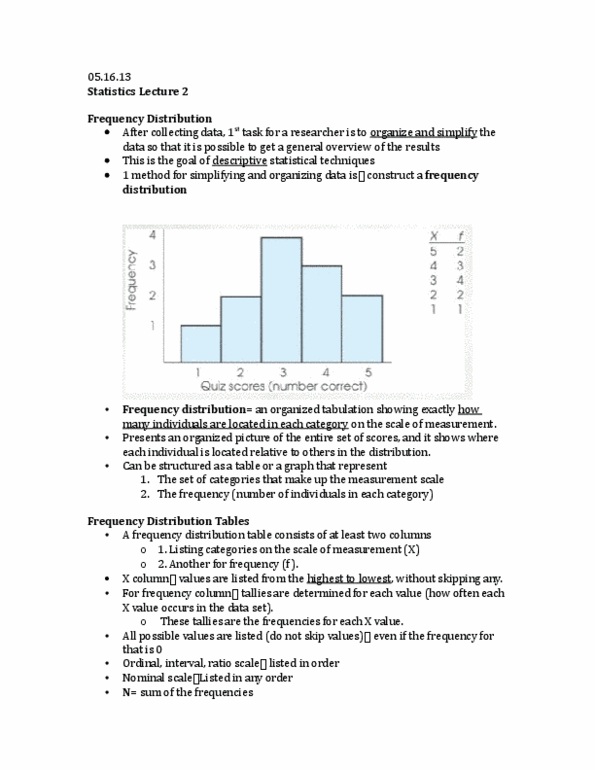
A frequency distribution presents the score values and their frequency occurrence. When grouping scores, some information is lost. The wider the interval, the more information is lost, the greater than ambiguity. The narrower the interval, the more information is preserved. If too narrow, there will be values with zero frequency and unclear display of the shape of the distribution. A relative frequency distribution is the proportion of the total number of scores that occur in each interval. A cumulative frequency distribution is the number of scores that fall below the upper real limit of each interval. A cumulative percentage distribution is the percentage of scores that fall below the upper real limit of each interval. A score at the 75th percentile means 75% of the scores fall below it. A percentile or percentile point is the value on the measurement scale below which a specific percentage of scores in the distribution fall. Start with the score in the data.