lemoncrow92

lemoncrow92

Lv7

Brock University

1 Follower
0 Following
0 Helped
hhh

ANSWERS

Published27

Subjects

English1Astronomy1Electrical Engineering1Algebra2Precalculus16Computer Science1Calculus1Biology3Mathematics1
Answer: The Chandrayaan missions, conducted by the Indian Space Research Organ...
Answer: To find the derivative �′(�)g′(x) of the function �(�)=�(�)�3g(x)=f(x)...
Answer: a) The vector 5v1 is obtained by scaling each component of v1 by a fac...
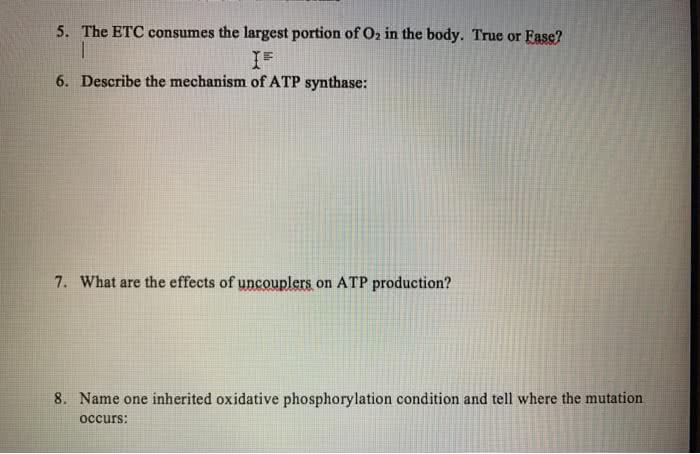
Answer: The ETC consumes the largest portion of O₂ in the body. True or False?...
Starch is not digested in the stomach primarily because the stomach's acidic a...
Answer: The largest cell in the world is the ostrich egg cell. Ostrich eggs ar...
Answer: ChatGPT "Physics" is the branch of science that deals with the study o...
Is being weird a good thing? Whether being "weird" is a good thing or not can ...

From 1946 to 1990, the Big Ten Conference consisted of the University of Illinois, Indiana University, University of Iowa, University of Michigan, Michigan State University, University of Minnesota, Northwestern University, Ohio State University, Purdue University, and University of Wisconsin. In 1990, the conference added Pennsylvania State University. In 2011, the conference added the University of Nebraska. In 2014, the University of Maryland and Rutgers University were added to the conference with speculation of more schools being added in the future.


The file BigTenExpand contains data on the football stadium capacity, latitude, longitude, endowment, and enrollment of 59 National Collegiate Athletic Association (NCAA) Football Bowl Subdivision (FBS) schools. Treat the 10 schools that were members of the Big Ten from 1946 to 1990 as being in a cluster and the other 49 schools as each being in their own cluster.

  1. Using Euclidean distance to measure dissimilarity between observations, determine which school (in its own cluster of one) that hierarchical clustering with complete linkage would recommend integrating into the Big Ten Conference. That is, which school is the most similar with respect to complete linkage to the cluster of ten schools that were members of the Big Ten from 1946 to 1990?
  2. Add the single school identified in (1) to create a cluster of 11 schools representing a hypothetical Big Ten Conference. Repeat the calculations to identify the school most similar with respect to complete linkage to this new cluster of 11 schools.
  3. Add the school identified in (2) to create a cluster of 12 schools representing a hypothetical Big Ten Conference. Repeat the calculations to identify the school most similar with respect to complete linkage to this new cluster of 12 schools.
  4. Add the school identified in (3) to create a cluster of 13 schools representing a hypothetical Big Ten Conference. Repeat the calculations to identify the school most similar with respect to complete linkage to this new cluster of 13 schools. Add this school to create a 14-school cluster.
  5. How does the hypothetical 14-team cluster created in (4) compare to the actual 14-team Big Ten Conference? For both the hypothetical 14-team Big Ten Conference and the actual 14-team Big Ten Conference, compute the cluster centroid, the distance from each cluster member to the cluster centroid, and average distance between the observations in the cluster. What do you observe when comparing these two clusters? Which cluster has the smaller average distance between observations? Is this surprising? Explain.
  6. Managerial Report, Excel .xlsx file, and PPT fileof the problem presentation with the problem solution analysis
  Candidates:             School StadiumCapacity Latitude Longitude Endowment ($000) Enrollment 1 Duke  -0.74515141 -1.300045853 0.915912002 2.544922985 -1.050282818 2 Maryland  0.111358164 -0.138951578 1.231986666 -0.2651109 0.911822867 3 North Carolina State 0.264350527 -1.361065861 0.956808902 -0.363877232 0.662673619 4 North Carolina 0.49479981 -1.320382904 0.895854619 0.567970634 0.164020841 5 Virginia  0.431604528 -0.50804171 0.984424237 1.98532706 -0.20886161 6 Virginia Tech 0.633701333 -0.817872556 0.674337675 -0.373507937 0.323359446 7 Wake Forest -0.849380926 -1.253200947 0.70075523 -0.114026658 -1.765579415 8 Iowa State 0.154057679 1.026631711 -1.432185292 -0.36691036 0.20600333 9 Kansas  -0.056408231 -0.151739047 -1.692329355 -0.00504443 0.057913198 10 Kansas State -0.059439896 -0.064241986 -1.905352822 -0.52274758 -0.303100786 11 Oklahoma  1.311726934 -1.497711435 -2.052762412 -0.026830328 0.30626531 12 Oklahoma State 0.376863749 -1.497711435 -2.052762412 -0.327522793 -0.270506785 13 West Virginia 0.390612993 0.107305772 0.750737953 -0.491820337 0.206534754 14 Cincinnati  -0.699932623 -0.083608387 0.023485011 -0.144580218 0.440981274 15 Louisville  0.196757195 -0.43592642 -0.173676014 -0.276254484 -0.543127256 16 Pittsburgh  0.583187807 0.416696149 0.746439418 0.719047505 0.131161128 17 Rutgers  0.045344714 0.43486666 1.629382017 -0.318017405 1.121735316 18 Syracuse  -0.090952138 1.418475699 1.358200152 -0.196014672 -0.571824148 19 Temple  0.731867518 0.250214942 1.519317648 -0.55491552 0.847609144 20 Nebraska  1.268130729 0.561925099 -1.921025795 -0.010071857 -0.238444209 21 Penn State 2.38647373 0.353876532 1.24001262 0.264129363 1.624639486 22 Charlotte  -1.541113072 -1.601475827 0.609516466 -0.634198726 -0.177861882 23 East Carolina -0.059439896 -1.44658928 1.161816151 -0.641208545 0.008933626 24 Marshall  -0.571150886 -0.363464608 0.354245565 -0.66657874 -1.179684542 25 Memphis  0.469180101 -1.636878928 -0.854583627 -0.603494898 -0.403894189 26 Old Dominion -1.348196662 -0.937056451 1.342098442 -0.617605265 -0.224272904 27 Tulsa  -0.676789486 -1.243325041 -1.797837725 -0.259941711 -2.054231174 28 Army  -0.486435048 0.772127113 1.696073321 -0.672600767 -2.007111586 29 Navy  -0.742632139 -0.148350822 1.300902417 -0.663193477 -2.011362978 30 Notre Dame 1.255491673 0.892623561 -0.257402957 2.835375737 -1.353460164 31 Akron  -0.913430199 0.663571849 0.49986072 -0.616847125 0.016373561 32 Ball State -1.233676563 0.292216227 -0.50909632 -0.634560501 -0.455088027 33 Bowling Green -1.181412356 0.776884874 0.159888404 -0.633702561 -0.859855913 34 Buffalo  -0.955574621 1.360237116 0.92473653 -0.433533702 0.13948677 35 Central Michigan -0.904932996 1.632354708 -0.01997824 -0.665752555 0.080498714 36 Eastern Michigan -0.904890296 1.111664608 0.164723897 -0.687394424 -0.349334667 37 Kent State -0.891226451 0.689240349 0.525242031 -0.692980392 0.050473263 38 Miami University -1.153145277 0.057259378 -0.01502846 -0.485543707 -0.875975772 39 Northern Illinois -0.870816083 0.990931755 -0.65424906 -0.685812933 -0.380422966 40 Ohio  -1.16962729 -0.012618913 0.4081514 -0.523575467 -0.096022598 41 Toledo  -1.07363878 0.888253521 0.171021978 -0.602182754 -0.414079814 42 Western Michigan -0.909160248 1.123407888 -0.149275242 -0.601580552 -0.194778876 43 Kentucky  0.692327767 -0.506002614 0.030906808 -0.194732014 -0.005237678 44 Missouri  0.83742072 -0.155108021 -1.224852237 -0.079560482 0.577468651 45 Tennessee  2.180363171 -1.302310959 0.112818725 -0.233061473 0.257640021 46 Vanderbilt  -0.495401946 -1.226460921 -0.340265882 1.222082883 -1.279769381 47 Arkansas State -0.872267866 -1.361112834 -0.962929221 -0.691716447 -1.185530205 48 Middle Tennessee -0.870730684 -1.348960272 -0.277976707 -0.677488701 -0.07467707 49 Western Kentucky -1.25502632 -0.917611505 -0.285422926 -0.649224305 -0.553490023                 Big Ten             School StadiumCapacity Latitude Longitude Endowment ($000) Enrollment 1 Illinois  0.39616393 0.291098113 -0.576520912 0.193512318 1.516494718 2 Indiana  0.065626984 -0.07379062 -0.299015746 0.178889342 1.368050303 3 Iowa  0.819529623 0.886058875 -1.098502436 -0.122052057 0.22362889 4 Michigan State 1.00911547 1.301000932 0.026938684 -0.533940497 1.830654826 5 Michigan  2.707659483 1.123658154 0.147208124 3.728560154 1.366721743 6 Minnesota  -0.025066787 2.158029349 -1.374918363 0.705385671 2.238345543 7 Northwestern  -0.091208336 1.035487299 -0.485474329 3.358842341 -0.648083481 8 Ohio State 2.174983032 0.243329145 0.265878343 0.488439062 2.62008506 9 Purdue  0.474304043 0.418798388 -0.360553436 0.420896539 1.094012701 10 Wisconsin  1.235252102 1.433391974 -0.755704228 0.347935893 1.342364813
Answer: Step-by-step explanation: To perform hierarchical clustering with comp...
To find the speed of the car in miles per hour, we first need to find the dist...
To solve for the time required for a given amount of a radioactive isotope to ...
To solve this problem, we can use the formula for radioactive decay: A = I * e...
To find M(I) given I = 62,000I0, you can simply substitute this value into the...
To find the magnitude and directional angle of vectors, you can use trigonomet...
To solve this problem, you can use trigonometry and create a right triangle ba...
To find the domain, range, and horizontal asymptotes of the exponential functi...
To analyze the given circuit using the principle of current mirrors, we'll fir...
Answer:
Answer: Step-by-step explanation: 2x=1
Answer: x1=-2,x2=2
Answer: x=9
Answer: x=0Step-by-step explanation: t= 1 ex= 1
Answer: FALSEStep-by-step explanation: e=0.5
Answer:
Answer: dy over dx =-24
Answer: (t1,x1) = (-√-1+√5,1-√5 over 2) (t2, x2)= (√-1+√5,1-√5 over 2)

(R6) A player is declared the winner if the other player loses, as described in (R3).
For example, if the game begins with 10 beans in one jar and 10 beans in the other jar,
the sequence of play could be:
Turn Number 1 2 3 4 5 6 7
Number of beans removed by Franco 1 3 4 1
Number of beans removed by Sarah 2 5 2
Number of beans remaining in the jars 10, 9 10, 7 7, 7 7, 2 3, 2 1, 2 0, 2
On the next turn, Sarah cannot remove 5 beans since the greatest number of beans
remaining in either jar is 2 and so after exactly 7 turns, Sarah loses and Franco wins.

(a) At the beginning of the first game, there are 40 beans in one jar and 0 beans in
the other jar. After a total of 10 turns (5 turns for each of Franco and Sarah),
what is the total number of beans left in the two jars?
(b) At the beginning of the second game, there are 384 beans in one jar and 0 beans
in the other jar. The game ends with a winner after a total of exactly n turns.
What is the value of n?
(c) At the beginning of the third game, there are 17 beans in one jar and 6 beans in
the other jar. There is a winning strategy that one player can follow to guarantee
that they are the winner. Determine which player has a winning strategy and
describe this strategy. (A winning strategy is a way for a player to choose a jar
on each turn so that they win no matter the choices of the other player.)
(d) At the beginning of the fourth game, there are 2023 beans in one jar and
2022 beans in the other jar. Determine which player has a winning strategy
and describe this strategy.

Answer: d

Weekly leaderboard

Start filling in the gaps now
Log in