MGCR 271- Midterm Exam Guide - Comprehensive Notes for the exam ( 38 pages long!)

11 Oct 2017
School
Department
Course
Professor
Document Summary
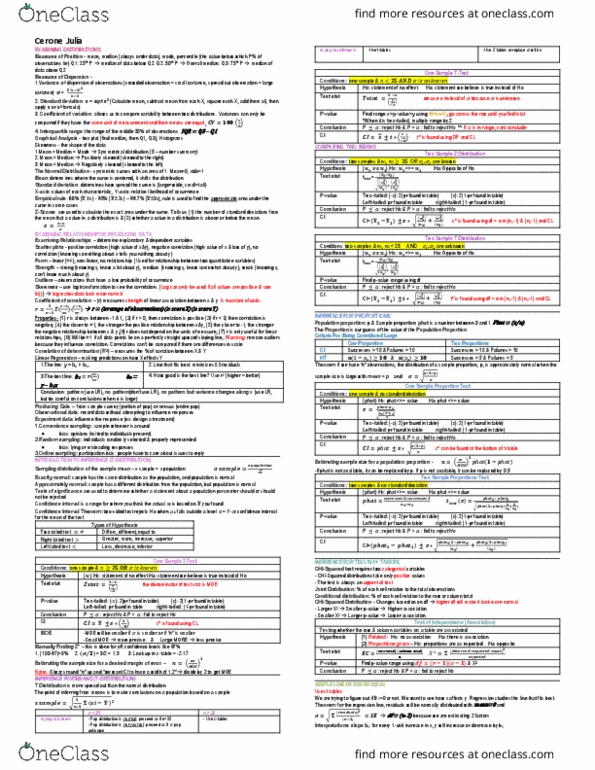
Make a bar graph, pie chart, and/or pareto chart of the distribution of a categorical variable. Interpret bar graphs, pie charts, and pareto charts. Make a histogram of the distribution of a quantitative variable. Make a stemplot of the distribution of a small set of observations. Round leaves or split stems as needed to make an effective stemplot. Look for the overall pattern and for major deviations from the pattern. Assess from a histogram or stemplot whether the shape of a distribution is roughly symmetric, distinctly skewed, or neither. Assess whether the distribution has one or more major peaks. Describe the overall pattern by giving numerical measures of center and spread in addition to a verbal description of shape. Decide which measures of center and spread are more appropriate: the mean and standard de(cid:448)iatio(cid:374) (cid:894)espe(cid:272)ially for sy(cid:373)(cid:373)etri(cid:272) distri(cid:271)utio(cid:374)s(cid:895) or the (cid:448)e-number summary (especially for skewed distributions).