COMMERCE 2QA3 Study Guide - Final Guide: Null Hypothesis, Confidence Interval, Randomized Experiment

28 Jun 2018
School
Department
Course
Professor

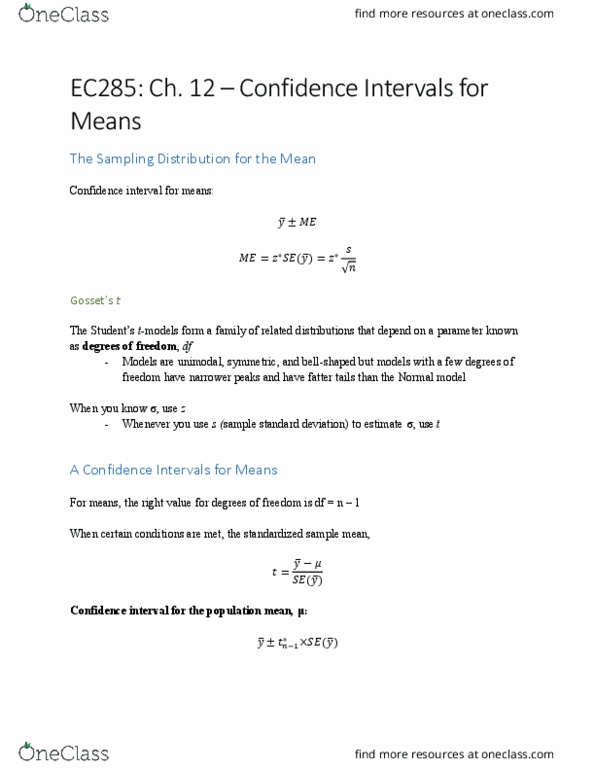
Confidence Intervals and Hypothesis Tests for Means
Use and of a sample with the t-distribution to construct a for the mean of the corresponding
population.
Sampling Distribution for the Mean
Type of Confidence Interval
Standard
Formula
Expanded Formula
Confidence intervals for proportions
Confidence intervals for means
Standard deviation for the sample
mean
Standard error of the mean
Note: useto denote
Student's t Distribution Model
Always unimodal, symmetric, and bell-shaped
•
T-models with few degrees of freedom have narrower peaks and fatter tails that Normal models
•
As the increase, the resemblance of t-model's to Normal models increases
•
William S. Gosset discovered that when the
is used, the curve is no longer Normally Distributed.
This model is always bell-shaped, but details change with samples sizes. Student's t distributions form a family of
related distributions depending on a parameter known as degrees of freedom, .
A Confidence Interval for Means
The standardized sample mean
follows a Student's t-model with .
One-Sided t-Interval
Confidence
interval for the
population mean
The confidence interval extends on either side of the mean by an amount known as the margin of error. The
critical value
depends on the confidence level and the number of , which is derived from the
sample size.
Assumptions and Conditions
Independence
Assumption
There is no way to check independence of the data , but you should consider whether
the assumption is reasonable.
Randomization
Condition
Data arises from a random sample or a suitably randomized experiment.
Confidence Intervals and Hypothesis Tests for Means
November 12, 2017
4:49 PM
Statistics Page 1
Document Summary
Use and of a sample with the t-distribution to construct a for the mean of the corresponding. William s. gosset discovered that when the is used, the curve is no longer normally distributed. related distributions depending on a parameter known as degrees of freedom, . As the increase, the resemblance of t-model"s to normal models increases. T-models with few degrees of freedom have narrower peaks and fatter tails that normal models. This model is always bell-shaped, but details change with samples sizes. The standardized sample mean follows a student"s t-model with . population mean critical value depends on the confidence level and the number of , which is derived from the. The confidence interval extends on either side of the mean by an amount known as the margin of error. There is no way to check independence of the data , but you should consider whether the assumption is reasonable.