COMMERCE 2QA3 Study Guide - Quiz Guide: Exponential Smoothing, Trend Analysis, Pearson Education

16 Dec 2014
School
Department
Course
Professor
Document Summary
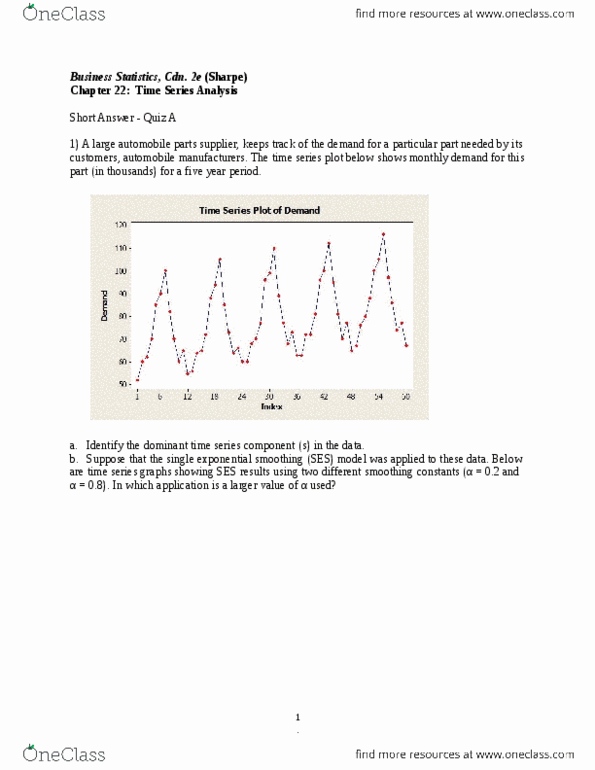
Short answer - quiz a: a large automobile parts supplier, keeps track of the demand for a particular part needed by its customers, automobile manufacturers. The time series plot below shows monthly demand for this part (in thousands) for a five year period. Identify the dominant time series component (s) in the data. a: suppose that the single exponential smoothing (ses) model was applied to these data. Answer: seasonality and trend, the ses model in ii has the larger value of , a model that incorporates seasonality, like a seasonal regression model. The exponential smoothing forecasts will always lag behind the actual values when seasonality / trend are present in the series. Copyright 2014 pearson canada inc: annual estimates of the population in the age group 65+ in a mid-sized city from 1999 (t = 1) onward are shown in the time series graph below. a.