FIN 305 Study Guide - Final Guide: Working Capital, Market Price, Current Liability
41 views2 pages

7 Dec 2015
School
Department
Course
Professor
Document Summary
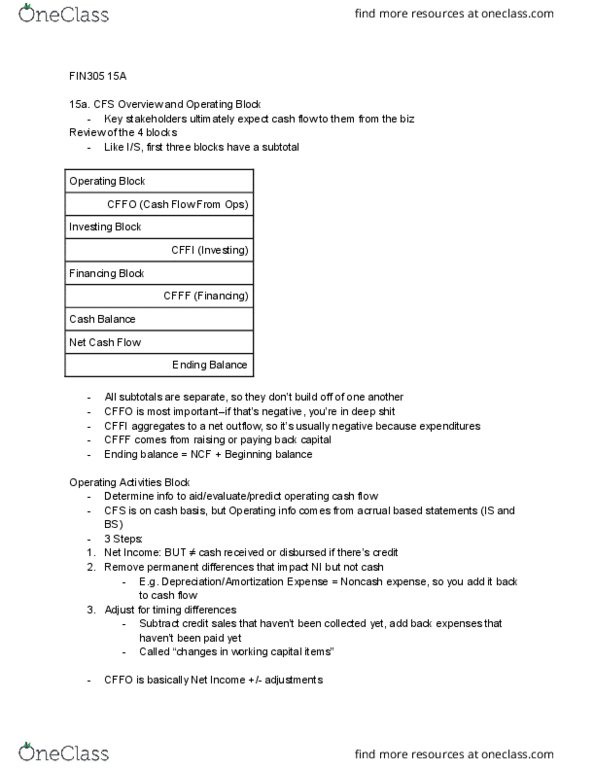
Ending value beginning value = increase/decrease ( ending value / beginning value ) 1 = % change. Total return / period = average annual % return. Change in wealth = amount $ business sold for . Continuity formula for determining cash balance: cash beg + inflows outflows = cash end. Cash flow from investing activities + cash flow from financing activities. Cash balance ending = cash balance beginning + net cash flow. % change = ( increase / starting value ) x 100. Ratio to sales revenue = operating income / sales. Operating profit margin = operating profit / sales x 100. Annual depreciation expense = ( cost of equipment . Interest = principal x interest rate x time. Operating profit = gross profit operating expense. Net income = operating profit miscellaneous expenses. Unit contribution = unit selling price sum of all unit costs for material, labour, other. Unit contribution margin = unit contribution / selling price x 100.
Get access
Grade+20% off
$8 USD/m$10 USD/m
Billed $96 USD annually

Homework Help
Study Guides
Textbook Solutions
Class Notes
Textbook Notes
Booster Class
40 Verified Answers
Related Documents
Related Questions
What are the Market Value Leverage Ratios (Value of Debt to Value of Equity, Value of Debt to Value of Assets)) for the following 2015 and 2016 financial data? (PLEASE SHOW WORK SO I CAN UNDERSTAND HOW THIS WAS DONE. Thank you)
| AMAZON.COM INC (AMZN) CashFlowFlag INCOME STATEMENT | ||
| Fiscal year ends in December. USD in millions except per share data. | 2015-12 | 2016-12 |
| Revenue | 107006 | 135987 |
| Cost of revenue | 71651 | 88265 |
| Gross profit | 35355 | 47722 |
| Operating expenses | ||
| Sales, General and administrative | 20411 | 27284 |
| Other operating expenses | 12711 | 16252 |
| Total operating expenses | 33122 | 43536 |
| Operating income | 2233 | 4186 |
| Interest Expense | 459 | 484 |
| Other income (expense) | -206 | 190 |
| Income before income taxes | 1568 | 3892 |
| Provision for income taxes | 950 | 1425 |
| Other income | -22 | -96 |
| Net income from continuing operations | 596 | 2371 |
| Net income | 596 | 2371 |
| Net income available to common shareholders | 596 | 2371 |
| Earnings per share | ||
| Basic | 1.28 | 5.01 |
| Diluted | 1.25 | 4.9 |
| Weighted average shares outstanding | ||
| Basic | 467 | 474 |
| Diluted | 477 | 484 |
| EBITDA | 8308 | 12492 |
| AMAZON.COM INC (AMZN) CashFlowFlag BALANCE SHEET | ||
| Fiscal year ends in December. USD in millions except per share data. | 2015-12 | 2016-12 |
| Assets | ||
| Current assets | ||
| Cash | ||
| Cash and cash equivalents | 15890 | 19334 |
| Short-term investments | 3918 | 6647 |
| Total cash | 19808 | 25981 |
| Receivables | 6423 | 8339 |
| Inventories | 10243 | 11461 |
| Deferred income taxes | ||
| Total current assets | 36474 | 45781 |
| Non-current assets | ||
| Property, plant and equipment | ||
| Land | 9770 | 13998 |
| Fixtures and equipment | 18417 | 25989 |
| Other properties | 1866 | 2454 |
| Property and equipment, at cost | 30053 | 42441 |
| Accumulated Depreciation | -8215 | -13327 |
| Property, plant and equipment, net | 21838 | 29114 |
| Goodwill | 3759 | 3784 |
| Intangible assets | ||
| Deferred income taxes | 1084 | |
| Other long-term assets | 2289 | 4723 |
| Total non-current assets | 28970 | 37621 |
| Total assets | 65444 | 83402 |
| Liabilities and stockholders' equity | ||
| Liabilities | ||
| Current liabilities | ||
| Accounts payable | 20397 | 25309 |
| Accrued liabilities | 10384 | 13739 |
| Deferred revenues | 3118 | 4768 |
| Total current liabilities | 33899 | 43816 |
| Non-current liabilities | ||
| Long-term debt | 8235 | 7694 |
| Capital leases | 5948 | 7519 |
| Deferred taxes liabilities | 392 | |
| Other long-term liabilities | 3978 | 4696 |
| Total non-current liabilities | 18161 | 20301 |
| Total liabilities | 52060 | 64117 |
| Stockholders' equity | ||
| Common stock | 5 | 5 |
| Additional paid-in capital | 13394 | 17186 |
| Retained earnings | 2545 | 4916 |
| Treasury stock | -1837 | -1837 |
| Accumulated other comprehensive income | -723 | -985 |
| Total stockholders' equity | 13384 | 19285 |
| Total liabilities and stockholders' equity | 65444 | 83402 |
| AMAZON.COM INC (AMZN) Statement of CASH FLOW | ||
| Fiscal year ends in December. USD in millions except per share data. | 2015-12 | 2016-12 |
| Cash Flows From Operating Activities | ||
| Net income | 596 | 2371 |
| Depreciation & amortization | 6281 | 8116 |
| Investments losses (gains) | 5 | |
| Deferred income taxes | 81 | -246 |
| Stock based compensation | 2119 | 2975 |
| Accounts receivable | -1755 | -3367 |
| Inventory | -2187 | -1426 |
| Accounts payable | 4294 | 5030 |
| Accrued liabilities | 913 | 1724 |
| Other working capital | 1292 | 1955 |
| Other non-cash items | 281 | -689 |
| Net cash provided by operating activities | 11920 | 16443 |
| Cash Flows From Investing Activities | ||
| Investments in property, plant, and equipment | -4589 | -6737 |
| Acquisitions, net | -795 | -116 |
| Purchases of investments | -4091 | -7756 |
| Sales/Maturities of investments | 3025 | 4733 |
| Net cash used for investing activities | -6450 | -9876 |
| Cash Flows From Financing Activities | ||
| Long-term debt issued | 353 | 621 |
| Long-term debt repayment | -4235 | -4361 |
| Excess tax benefit from stock based compensation | 119 | 829 |
| Repurchases of treasury stock | ||
| Net cash provided by (used for) financing activities | -3763 | -2911 |
| Effect of exchange rate changes | -374 | -212 |
| Net change in cash | 1333 | 3444 |
| Cash at beginning of period | 14557 | 15890 |
| Cash at end of period | 15890 | 19334 |
| Free Cash Flow | ||
| Operating cash flow | 11920 | 16443 |
| Capital expenditure | -4589 | -6737 |
| Free cash flow | 7331 | 9706 |
| Supplemental schedule of cash flow data | ||
| Cash paid for income taxes | 273 | 412 |
| Cash paid for interest | 478 | 496 |

What are the Balance Sheet Ratios (debt-to-asset and debt-to-equity ratios) for the following financial information for 2015 and 2016? (PLEASE SHOW WORK SO I CAN UNDERSTAND HOW THIS WAS DONE. Thank you)
| AMAZON.COM INC (AMZN) CashFlowFlag INCOME STATEMENT | ||
| Fiscal year ends in December. USD in millions except per share data. | 2015-12 | 2016-12 |
| Revenue | 107006 | 135987 |
| Cost of revenue | 71651 | 88265 |
| Gross profit | 35355 | 47722 |
| Operating expenses | ||
| Sales, General and administrative | 20411 | 27284 |
| Other operating expenses | 12711 | 16252 |
| Total operating expenses | 33122 | 43536 |
| Operating income | 2233 | 4186 |
| Interest Expense | 459 | 484 |
| Other income (expense) | -206 | 190 |
| Income before income taxes | 1568 | 3892 |
| Provision for income taxes | 950 | 1425 |
| Other income | -22 | -96 |
| Net income from continuing operations | 596 | 2371 |
| Net income | 596 | 2371 |
| Net income available to common shareholders | 596 | 2371 |
| Earnings per share | ||
| Basic | 1.28 | 5.01 |
| Diluted | 1.25 | 4.9 |
| Weighted average shares outstanding | ||
| Basic | 467 | 474 |
| Diluted | 477 | 484 |
| EBITDA | 8308 | 12492 |
| AMAZON.COM INC (AMZN) CashFlowFlag BALANCE SHEET | ||
| Fiscal year ends in December. USD in millions except per share data. | 2015-12 | 2016-12 |
| Assets | ||
| Current assets | ||
| Cash | ||
| Cash and cash equivalents | 15890 | 19334 |
| Short-term investments | 3918 | 6647 |
| Total cash | 19808 | 25981 |
| Receivables | 6423 | 8339 |
| Inventories | 10243 | 11461 |
| Deferred income taxes | ||
| Total current assets | 36474 | 45781 |
| Non-current assets | ||
| Property, plant and equipment | ||
| Land | 9770 | 13998 |
| Fixtures and equipment | 18417 | 25989 |
| Other properties | 1866 | 2454 |
| Property and equipment, at cost | 30053 | 42441 |
| Accumulated Depreciation | -8215 | -13327 |
| Property, plant and equipment, net | 21838 | 29114 |
| Goodwill | 3759 | 3784 |
| Intangible assets | ||
| Deferred income taxes | 1084 | |
| Other long-term assets | 2289 | 4723 |
| Total non-current assets | 28970 | 37621 |
| Total assets | 65444 | 83402 |
| Liabilities and stockholders' equity | ||
| Liabilities | ||
| Current liabilities | ||
| Accounts payable | 20397 | 25309 |
| Accrued liabilities | 10384 | 13739 |
| Deferred revenues | 3118 | 4768 |
| Total current liabilities | 33899 | 43816 |
| Non-current liabilities | ||
| Long-term debt | 8235 | 7694 |
| Capital leases | 5948 | 7519 |
| Deferred taxes liabilities | 392 | |
| Other long-term liabilities | 3978 | 4696 |
| Total non-current liabilities | 18161 | 20301 |
| Total liabilities | 52060 | 64117 |
| Stockholders' equity | ||
| Common stock | 5 | 5 |
| Additional paid-in capital | 13394 | 17186 |
| Retained earnings | 2545 | 4916 |
| Treasury stock | -1837 | -1837 |
| Accumulated other comprehensive income | -723 | -985 |
| Total stockholders' equity | 13384 | 19285 |
| Total liabilities and stockholders' equity | 65444 | 83402 |
| AMAZON.COM INC (AMZN) Statement of CASH FLOW | ||
| Fiscal year ends in December. USD in millions except per share data. | 2015-12 | 2016-12 |
| Cash Flows From Operating Activities | ||
| Net income | 596 | 2371 |
| Depreciation & amortization | 6281 | 8116 |
| Investments losses (gains) | 5 | |
| Deferred income taxes | 81 | -246 |
| Stock based compensation | 2119 | 2975 |
| Accounts receivable | -1755 | -3367 |
| Inventory | -2187 | -1426 |
| Accounts payable | 4294 | 5030 |
| Accrued liabilities | 913 | 1724 |
| Other working capital | 1292 | 1955 |
| Other non-cash items | 281 | -689 |
| Net cash provided by operating activities | 11920 | 16443 |
| Cash Flows From Investing Activities | ||
| Investments in property, plant, and equipment | -4589 | -6737 |
| Acquisitions, net | -795 | -116 |
| Purchases of investments | -4091 | -7756 |
| Sales/Maturities of investments | 3025 | 4733 |
| Net cash used for investing activities | -6450 | -9876 |
| Cash Flows From Financing Activities | ||
| Long-term debt issued | 353 | 621 |
| Long-term debt repayment | -4235 | -4361 |
| Excess tax benefit from stock based compensation | 119 | 829 |
| Repurchases of treasury stock | ||
| Net cash provided by (used for) financing activities | -3763 | -2911 |
| Effect of exchange rate changes | -374 | -212 |
| Net change in cash | 1333 | 3444 |
| Cash at beginning of period | 14557 | 15890 |
| Cash at end of period | 15890 | 19334 |
| Free Cash Flow | ||
| Operating cash flow | 11920 | 16443 |
| Capital expenditure | -4589 | -6737 |
| Free cash flow | 7331 | 9706 |
| Supplemental schedule of cash flow data | ||
| Cash paid for income taxes | 273 | 412 |
| Cash paid for interest | 478 | 496 |

What is the return on Invested Capital (ROIC) for the 2015 and 2016 financial data? Please show work. Thank you very much.
| AMAZON.COM INC (AMZN) CashFlowFlag INCOME STATEMENT | ||
| Fiscal year ends in December. USD in millions except per share data. | 2015-12 | 2016-12 |
| Revenue | 107006 | 135987 |
| Cost of revenue | 71651 | 88265 |
| Gross profit | 35355 | 47722 |
| Operating expenses | ||
| Sales, General and administrative | 20411 | 27284 |
| Other operating expenses | 12711 | 16252 |
| Total operating expenses | 33122 | 43536 |
| Operating income | 2233 | 4186 |
| Interest Expense | 459 | 484 |
| Other income (expense) | -206 | 190 |
| Income before income taxes | 1568 | 3892 |
| Provision for income taxes | 950 | 1425 |
| Other income | -22 | -96 |
| Net income from continuing operations | 596 | 2371 |
| Net income | 596 | 2371 |
| Net income available to common shareholders | 596 | 2371 |
| Earnings per share | ||
| Basic | 1.28 | 5.01 |
| Diluted | 1.25 | 4.9 |
| Weighted average shares outstanding | ||
| Basic | 467 | 474 |
| Diluted | 477 | 484 |
| EBITDA | 8308 | 12492 |
| AMAZON.COM INC (AMZN) CashFlowFlag BALANCE SHEET | ||
| Fiscal year ends in December. USD in millions except per share data. | 2015-12 | 2016-12 |
| Assets | ||
| Current assets | ||
| Cash | ||
| Cash and cash equivalents | 15890 | 19334 |
| Short-term investments | 3918 | 6647 |
| Total cash | 19808 | 25981 |
| Receivables | 6423 | 8339 |
| Inventories | 10243 | 11461 |
| Deferred income taxes | ||
| Total current assets | 36474 | 45781 |
| Non-current assets | ||
| Property, plant and equipment | ||
| Land | 9770 | 13998 |
| Fixtures and equipment | 18417 | 25989 |
| Other properties | 1866 | 2454 |
| Property and equipment, at cost | 30053 | 42441 |
| Accumulated Depreciation | -8215 | -13327 |
| Property, plant and equipment, net | 21838 | 29114 |
| Goodwill | 3759 | 3784 |
| Intangible assets | ||
| Deferred income taxes | 1084 | |
| Other long-term assets | 2289 | 4723 |
| Total non-current assets | 28970 | 37621 |
| Total assets | 65444 | 83402 |
| Liabilities and stockholders' equity | ||
| Liabilities | ||
| Current liabilities | ||
| Accounts payable | 20397 | 25309 |
| Accrued liabilities | 10384 | 13739 |
| Deferred revenues | 3118 | 4768 |
| Total current liabilities | 33899 | 43816 |
| Non-current liabilities | ||
| Long-term debt | 8235 | 7694 |
| Capital leases | 5948 | 7519 |
| Deferred taxes liabilities | 392 | |
| Other long-term liabilities | 3978 | 4696 |
| Total non-current liabilities | 18161 | 20301 |
| Total liabilities | 52060 | 64117 |
| Stockholders' equity | ||
| Common stock | 5 | 5 |
| Additional paid-in capital | 13394 | 17186 |
| Retained earnings | 2545 | 4916 |
| Treasury stock | -1837 | -1837 |
| Accumulated other comprehensive income | -723 | -985 |
| Total stockholders' equity | 13384 | 19285 |
| Total liabilities and stockholders' equity | 65444 | 83402 |
| AMAZON.COM INC (AMZN) Statement of CASH FLOW | ||
| Fiscal year ends in December. USD in millions except per share data. | 2015-12 | 2016-12 |
| Cash Flows From Operating Activities | ||
| Net income | 596 | 2371 |
| Depreciation & amortization | 6281 | 8116 |
| Investments losses (gains) | 5 | |
| Deferred income taxes | 81 | -246 |
| Stock based compensation | 2119 | 2975 |
| Accounts receivable | -1755 | -3367 |
| Inventory | -2187 | -1426 |
| Accounts payable | 4294 | 5030 |
| Accrued liabilities | 913 | 1724 |
| Other working capital | 1292 | 1955 |
| Other non-cash items | 281 | -689 |
| Net cash provided by operating activities | 11920 | 16443 |
| Cash Flows From Investing Activities | ||
| Investments in property, plant, and equipment | -4589 | -6737 |
| Acquisitions, net | -795 | -116 |
| Purchases of investments | -4091 | -7756 |
| Sales/Maturities of investments | 3025 | 4733 |
| Net cash used for investing activities | -6450 | -9876 |
| Cash Flows From Financing Activities | ||
| Long-term debt issued | 353 | 621 |
| Long-term debt repayment | -4235 | -4361 |
| Excess tax benefit from stock based compensation | 119 | 829 |
| Repurchases of treasury stock | ||
| Net cash provided by (used for) financing activities | -3763 | -2911 |
| Effect of exchange rate changes | -374 | -212 |
| Net change in cash | 1333 | 3444 |
| Cash at beginning of period | 14557 | 15890 |
| Cash at end of period | 15890 | 19334 |
| Free Cash Flow | ||
| Operating cash flow | 11920 | 16443 |
| Capital expenditure | -4589 | -6737 |
| Free cash flow | 7331 | 9706 |
| Supplemental schedule of cash flow data | ||
| Cash paid for income taxes | 273 | 412 |
| Cash paid for interest | 478 | 496 |
