[GEO 301] - Final Exam Guide - Ultimate 31 pages long Study Guide!

29 Nov 2016
School
Department
Course
Professor
Document Summary
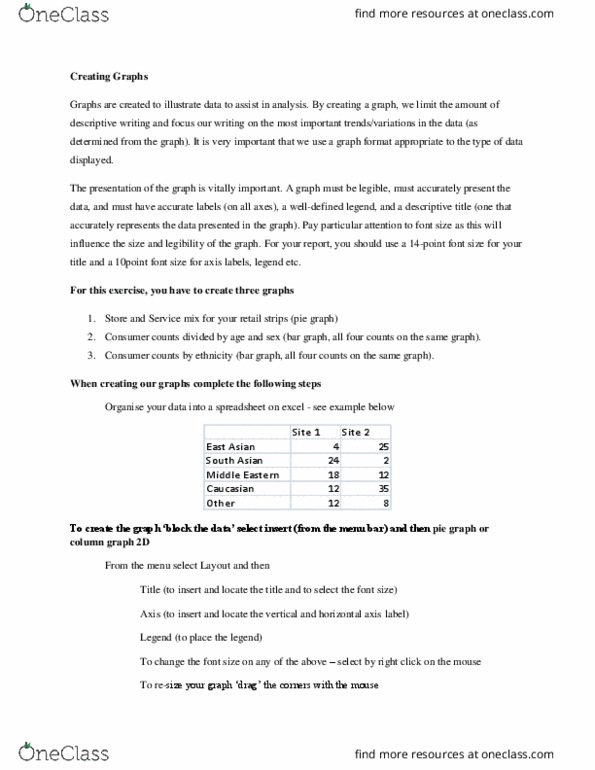
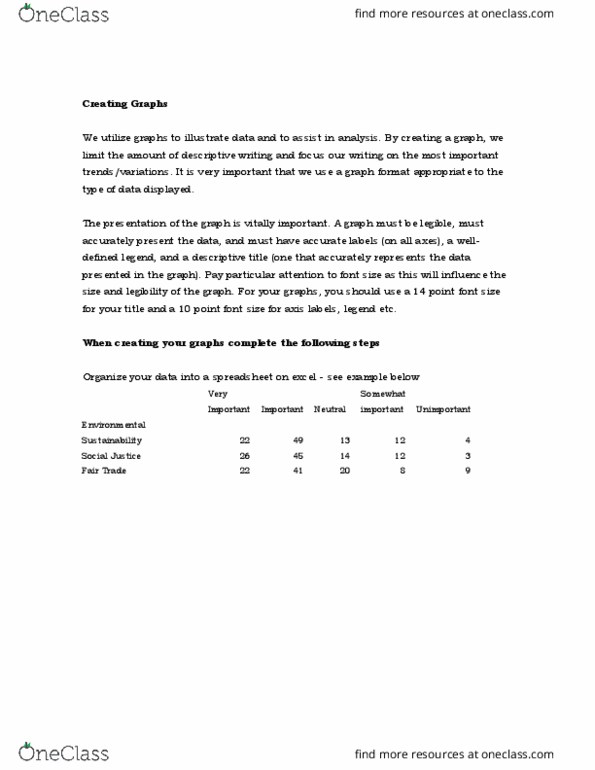
Graphs are created to illustrate data to assist in analysis. By creating a graph, we limit the amount of descriptive writing and focus our writing on the most important trends/variations in the data (as determined from the graph). It is very important that we use a graph format appropriate to the type of data displayed. The presentation of the graph is vitally important. A graph must be legible, must accurately present the data, and must have accurate labels (on all axes), a well-defined legend, and a descriptive title (one that accurately represents the data presented in the graph). Pay particular attention to font size as this will influence the size and legibility of the graph. For your report, you should use a 14-point font size for your title and a 10point font size for axis labels, legend etc. When creating our graphs complete the following steps. Organise your data into a spreadsheet on excel - see example below.