ITM 207 Study Guide - Midterm Guide: Cbre Group, Bar Chart, Cumulative Frequency Analysis

1 Mar 2016
School
Department
Course
Professor
Document Summary
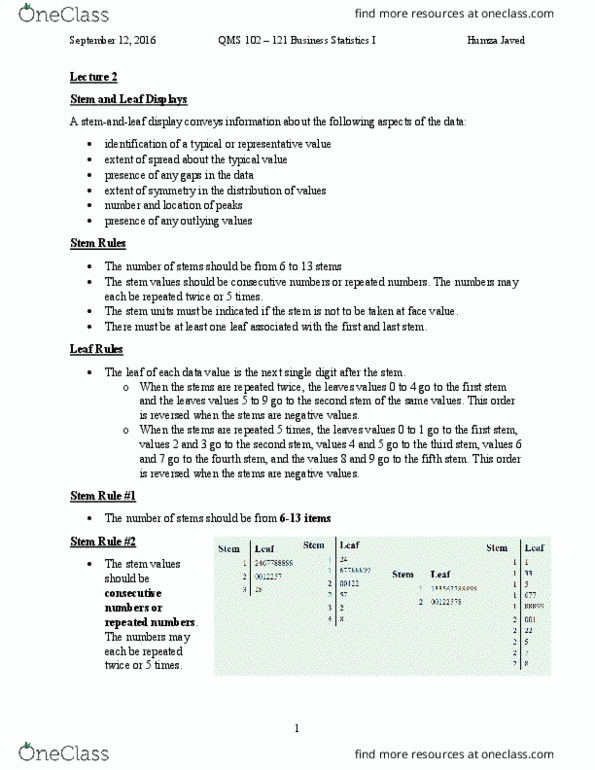
Forty people were each asked how many times they ate at their favorite restaurant in the last 12 months. Reconstruct the stem-and-leaf display, so that it will comply with the rules discussed in lectures. How many leaves would there be on the third stem of the corrected stem and. If a frequency distribution with equal sized classes was made from the original given data, and the first class was 0 and under 5 , the relative frequency of the second class would be: How many people ate more than 25 times at their favorite restaurant in the last. If a frequency distribution with equal sized classes was made from the original given data, and the first class was 0 and under 5 , the cumulative percentage of up to and including the fourth class would be: Calculate cumulative frequency of people who ate more than 20 times at their favorite restaurant in the last 12 months.