QMS 102 Study Guide - Radial Tire, Random Variable, Retread

9 Dec 2013
School
Department
Course
Professor
Document Summary
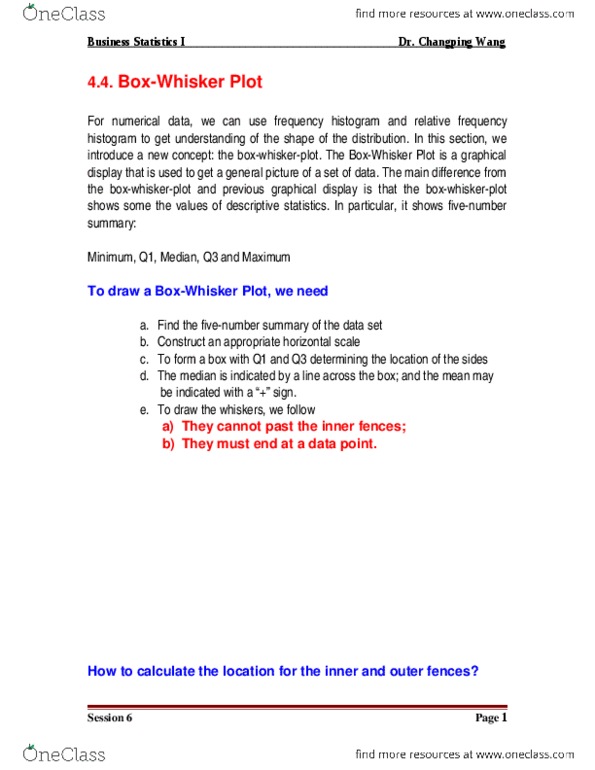
For numerical data, we can use frequency histogram and relative frequency histogram to get understanding of the shape of the distribution. In this section, we introduce a new concept: the box- whisker-plot. The box-whisker plot is a graphical display that is used to get a general picture of a set of data. The main difference from the box-whisker- plot and previous graphical display is that the box- whisker-plot shows some the values of descriptive statistics. + sign: to draw the whiskers, we follow a)they cannot past the inner fences; b)they must end at a data point. Fence; (3) all data values that fall between the fences are call suspected outliers, using o to indicate them; all data values that lie beyond the outer fences are call outliers, using * to indicate them. The test score of 15 employees enrolled in a cpr training course are listed as follows: